
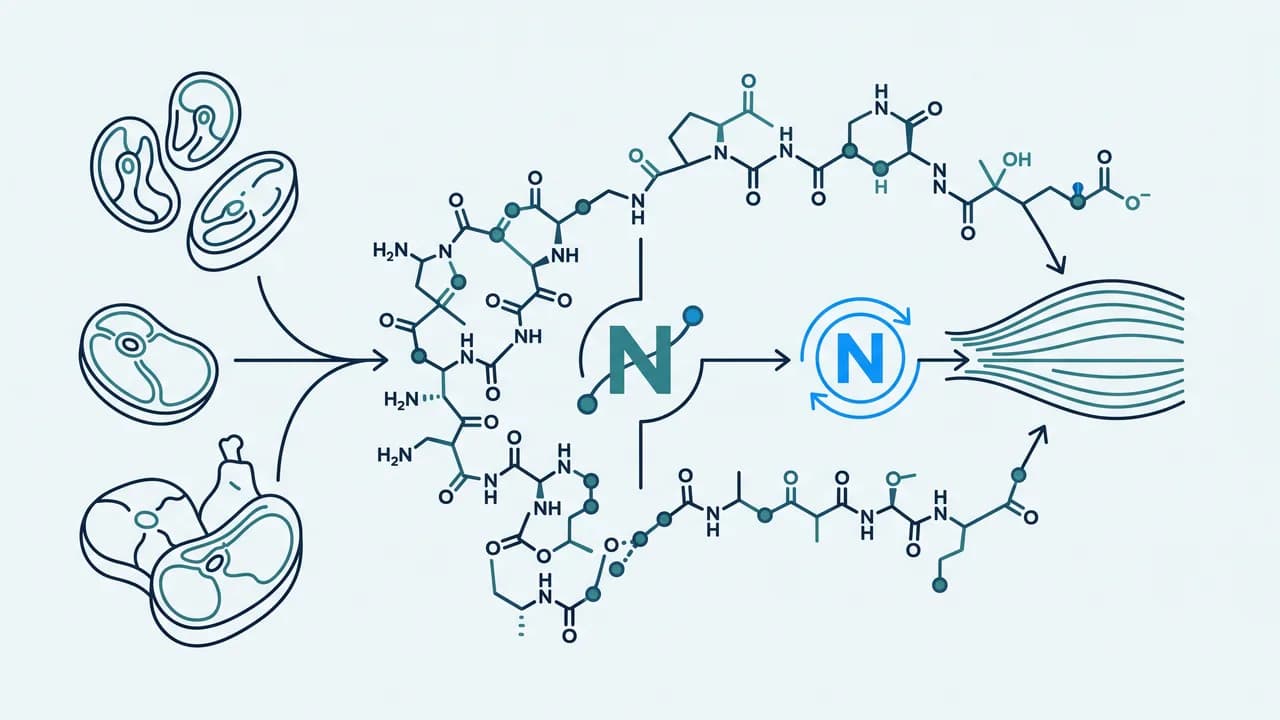
High-Protein Diets
Whole-diet patterns and eating schedules. A research review published by South Beach Longevity.
Evidence is labelled by study type in the sentence that reports it. In vitro names a cell or reconstituted system. Animal names the species. Human means people. A quantity appears only as it was studied, with the population and duration attached. Acute tracer-measured muscle protein synthesis is not hypertrophy. Rodent lifespan is not a human survival result. Protein quantity is not food source.
Findings are graded in place as established, strongly supported, emerging, plausible, or speculative. Conflict is presented as conflict. No human use, dose, route or schedule is recommended anywhere in this document.
00 Abstract
The adult protein Recommended Dietary Allowance of 0.80 g·kg−1·d−1 is a nitrogen-balance estimate of the intake that covers the estimated average requirement of a reference adult plus two standard deviations (Rand et al., 2003; Trumbo et al., 2002). It is not an optimum for lean-mass retention under energy deficit, for older adults with anabolic resistance, or for people who train. Human dose–response infusions after resistance exercise saturate mixed-muscle protein synthesis near 20 g of high-quality protein in young men performing isolated-leg work (Moore et al., 2009), while whole-body sessions and older muscle shift that ceiling upward (Macnaughton et al., 2016; Moore et al., 2015). A meta-regression of protein supplementation during resistance training placed a breakpoint for fat-free mass near 1.62 g·kg−1·d−1 (Morton et al., 2018). Those are not the same claim.
In energy restriction, higher-protein diets have, in human meta-analysis and in a tightly controlled training trial, favoured fat loss and lean-mass retention relative to lower-protein comparisons at similar energy (Wycherley et al., 2012; Longland et al., 2016). In healthy kidneys, randomised comparisons have not shown a clinically meaningful deterioration of glomerular filtration rate attributable to higher versus lower protein (Devries et al., 2018); they have shown reversible haemodynamic hyperfiltration (Juraschek et al., 2013). In chronic kidney disease the question changes species: guideline instruments restrict protein in metabolically stable non-dialysis CKD (Ikizler et al., 2020). Prospective cohorts that appear to indict “protein” usually indict a food — processed meat more than fish, red meat more than legumes (Pan et al., 2012; Zhong et al., 2020; Naghshi et al., 2020). The mechanistic argument that chronic high protein shortens life by driving mTOR and IGF-1 is a real biochemistry (Saxton and Sabatini, 2017) that has not been converted into a protein-controlled human survival trial. Mouse geometric-framework work finds the opposite macronutrient optimum from the gym (Solon-Biet et al., 2014). Both results can be true of their own systems. They are not interchangeable.
01 Four units, not one adjective
The phrase “high-protein diet” is not a scientific exposure until it is restated in four units. Absolute intake is grams per day. Relative intake is grams per kilogram of body mass per day — and the kilogram must be named as actual body mass, fat-free mass, or a reference body mass, because the same 120 g·d−1 is 2.0 g·kg−1 in a 60 kg adult and 1.2 g·kg−1 in a 100 kg adult. Energy share is the percentage of metabolisable energy supplied by protein, using the Atwater factor of 17 kJ·g−1 (4 kcal·g−1). Energy context is whether those numbers were recorded in deficit, balance, or surplus, because protein that is eaten while glycogen and fat are being oxidised is not the same physiological event as protein eaten while all three fuels are being stored.
Those four numbers are not interchangeable restatements. Hold energy and body mass constant and raise protein: the percentage of energy rises and carbohydrate or fat must fall. Hold grams per day constant and lose 15 kg: grams per kilogram rise without any dietary change. Hold grams per kilogram constant and compare a 1,600 kcal reducing diet with a 3,200 kcal surplus: the same relative protein is a different fraction of energy and a different competitor for other macronutrients. The Institute of Medicine Acceptable Macronutrient Distribution Range for protein is 10–35% of energy (Trumbo et al., 2002). A 70 kg adult eating 0.80 g·kg−1·d−1 on 2,400 kcal is at about 9% of energy — below the AMDR floor — while the same adult eating 1.6 g·kg−1·d−1 on a 1,600 kcal deficit is at about 28% of energy. Both are ordinary numbers in the literature. Calling both, or neither, “high protein” without the four-unit statement is the first analytical failure this article is written to prevent.
A working vocabulary used in this document, and not treated as a biological law: intakes near the RDA (~0.8 g·kg−1·d−1, often ~10% of energy at typical adult energy intakes) are requirement-range; 1.2–1.6 g·kg−1·d−1 in weight-stable or training adults are elevated; intakes at or above ~2.0 g·kg−1·d−1, or protein shares approaching the upper AMDR in energy restriction, are high in the sense the trials and position stands actually used (Phillips, 2016; Jäger et al., 2017; Morton et al., 2018). The labels are operational. They are not a recommendation.
02 How the requirement was built
Nineteenth-century physiologists treated protein as the tissue nutrient and guessed high. Carl Voit’s 118 g·d−1 for a 70 kg labourer, and the Atwater-era American figures that followed it, were observations of what working men ate, not measurements of what they needed. The modern requirement is a nitrogen-balance construction. Nitrogen in (diet) minus nitrogen out (urine, faeces, skin, miscellaneous) is set to zero, and the intake that achieves zero in a group of healthy adults is taken as the estimated average requirement. Rand, Pellett and Young meta-analysed short-term nitrogen-balance studies in healthy adults and estimated a median requirement of 0.65 g·kg−1·d−1 and a 97.5th-percentile recommended intake of 0.83 g·kg−1·d−1 (Rand et al., 2003). The Institute of Medicine rounded that recommendation to 0.80 g·kg−1·d−1 and set the AMDR at 10–35% of energy (Trumbo et al., 2002). That is the origin of the number that is still printed on every American food label as if it were an optimum.
It is not. Nitrogen balance underestimates the intake that preserves function when the endpoint is lean mass, strength, or recovery rather than zero nitrogen. The method is sensitive to energy intake, to the adaptive downregulation of amino-acid oxidation as intake falls, and to incomplete collection of miscellaneous losses (Millward, 1999, 2001). Indicator amino-acid oxidation, which estimates requirement from the breakpoint at which a labelled indispensable amino acid stops being oxidised because it is being incorporated, has repeatedly returned higher estimates than classical balance for several indispensable amino acids and, in some applications, for total protein (Elango et al., 2008; Courtney-Martin et al., 2016). The two methods do not always agree. Neither is a hypertrophy prescription. Phillips’s review of intakes “beyond the RDA” is the cleanest statement of the gap: the RDA is a deficiency floor derived from one method in one population, and the intakes that support muscle in trained or older adults sit above it (Phillips, 2016).
The RDA is the estimated intake sufficient to meet the requirement of nearly all (97–98%) healthy individuals in a life-stage group, constructed from an average requirement plus two standard deviations (Trumbo et al., 2002). It is not the intake that maximises muscle protein synthesis, not the intake that minimises lean-mass loss in a deficit, and not a safety ceiling. The AMDR upper bound of 35% of energy is a chronic-disease risk-management range, not a demonstrated toxic threshold.
03 Digestion, amino acids, nitrogen
Dietary protein is hydrolysed in the stomach and small intestine to peptides and free amino acids. Absorption is efficient for most mixed meals; the nutritional difference among foods is less whether nitrogen crosses the gut than which amino acids cross and how fast. Boirie and colleagues distinguished “fast” whey from “slow” casein in human tracer studies: whey produced a rapid, high, transient rise in aminoacidaemia and oxidation, casein a prolonged, lower plateau and better net postprandial protein accretion under the conditions of that experiment (Boirie et al., 1997). The finding is kinetics, not a ranking of foods for every endpoint. A large and amino-acid-specific fraction of the meal is extracted by the splanchnic bed — gut and liver — before skeletal muscle sees it. Volpi’s elderly-adult work is the human demonstration that first-pass extraction is higher with age and that essential amino acids, not the non-essential fraction, drive the peripheral anabolic response (Volpi et al., 1999, 2003).
Amino acids that escape first-pass use enter the free pool, charge tRNA, and are used for protein synthesis, or are transaminated and oxidised. The carbon skeletons feed glucose (glucogenic) or ketone (ketogenic) pathways; the nitrogen is disposed of as urea. There is no storage protein analogous to glycogen or triglyceride. What is commonly called a protein store is the slow turnover of lean tissue. Nitrogen balance is therefore a rate, not a reservoir: the adult who is “in balance” is replacing what is being broken down, not filling a tank. Diet-induced thermogenesis is higher for protein than for carbohydrate or fat. In human respiration-chamber work, Westerterp measured a thermic effect on the order of 20–30% of protein energy, against roughly 5–10% for carbohydrate and 0–3% for fat (Westerterp, 2004; Westerterp et al., 1999). Halton and Hu’s critical review reached the same qualitative conclusion and added the satiety literature (Halton and Hu, 2004). Those are established physiological costs of processing protein. They are not, by themselves, a weight-loss drug.
04 Satiety is not a single hormone
Protein is the most satiating macronutrient in acute human meal studies, with supporting evidence from ghrelin suppression after a high-protein breakfast (Blom et al., 2006) and from 24-hour chamber work in which a high-protein condition raised diet-induced thermogenesis and satiety relative to high-fat (Westerterp-Plantenga et al., 1999, 2009; Lejeune et al., 2006). Leidy’s reviews treat higher protein as a dietary strategy that can reduce daily energy intake and help weight-loss maintenance, with the important qualifier that the effect is context-dependent and not large enough to override an energy surplus (Leidy et al., 2014, 2015). Simpson and Raubenheimer’s protein-leverage hypothesis is a different claim: animals, including humans, prioritise a protein target and will over-eat energy on a low-protein diet to reach it (Simpson and Raubenheimer, 2005; Raubenheimer and Simpson, 2019). Gosby and colleagues reported human evidence consistent with leverage under controlled conditions (Gosby et al., 2014). The hypothesis is plausible and mechanistically tidy. It is not established as the dominant explanation of population obesity, and it does not license the reverse inference that any high-protein diet is automatically hypocaloric.
05 Acute muscle protein synthesis
Skeletal muscle protein synthesis (MPS) can be measured in humans with stable-isotope tracers over hours. After resistance exercise, mixed-muscle MPS in young men rose with ingested egg protein and plateaued at 20 g; 40 g produced no further mixed-muscle synthesis and increased amino-acid oxidation (Moore et al., 2009). Witard and colleagues, using whey and a myofibrillar-specific measurement, likewise found 20 g sufficient after unilateral exercise, with 40 g adding only a modest further increment (Witard et al., 2014). Macnaughton then changed the session: after whole-body resistance exercise, 40 g of whey raised myofibrillar MPS more than 20 g (Macnaughton et al., 2016). The ceiling is not a constant. It moves with how much muscle was recruited, with the protein’s amino-acid pattern, and with the age of the muscle.
Protein quality appears in the acute record as a difference among isolates. Tang and colleagues reported that, after resistance exercise, whey hydrolysate stimulated mixed-muscle MPS more than soy, and soy more than casein, in young men (Tang et al., 2009). Wilkinson and colleagues found that fat-free milk supported greater net muscle protein balance after exercise than an isonitrogenous soy drink (Wilkinson et al., 2007). Yang and colleagues later showed that older men required more whey than young men to saturate myofibrillar MPS, and that soy was a weaker stimulus than whey at equal doses (Yang et al., 2012a, 2012b). These are acute, isolate, tracer studies. They are established as descriptions of the hours after a drink. They are not food-pattern epidemiology, and they are not hypertrophy trials.
06 Hypertrophy, training, recovery
The conversion of an acute MPS pulse into months of fibre growth is not automatic. Morton, Phillips and colleagues meta-analysed protein supplementation during prolonged resistance training. Supplementation increased fat-free-mass gains relative to control; a two-phase regression placed a breakpoint at approximately 1.62 g·kg−1·d−1, beyond which further protein did not further increase fat-free mass (Morton et al., 2018). The mean fat-free-mass increment attributable to supplementation was small in absolute terms (~0.3 kg). The result is strongly supported for trained and untrained adults in the trial set that entered the meta-analysis. It is not a demonstration that 1.62 g·kg−1 is a universal optimum, and it is not a demonstration that 2.2 g·kg−1 is harmful. It is a statement about diminishing returns for fat-free mass under the training programmes studied.
The International Society of Sports Nutrition position stand places a daily range of 1.4–2.0 g·kg−1 for exercising individuals, with higher intakes considered in energy restriction (Jäger et al., 2017; Aragon et al., 2017). Helms and colleagues, reviewing protein during caloric restriction in lean resistance-trained athletes, argued for the upper part of that range when the goal is to hold lean mass at low body fat (Helms et al., 2014). Those are position-stand and narrative-review inferences from a thin trial base in very lean athletes. They are not RDA revisions.
Recovery is a narrower question. Pre-sleep casein has been shown, in human tracer studies, to raise overnight myofibrillar protein synthesis and to be incorporated into muscle overnight (Trommelen et al., 2016, 2018). That is an acute recovery mechanism. It is not, by itself, a year of added muscle. Areta and colleagues distributed 80 g of whey across twelve hours as 8×10 g, 4×20 g, or 2×40 g after resistance exercise; the 20 g every three hours condition produced the highest integrated myofibrillar MPS (Areta et al., 2013). Again: hours, not months.
07 Leucine, meals, anabolic resistance
Leucine is the indispensable amino acid most clearly implicated in activating mTORC1 in muscle. Churchward-Venne and colleagues showed that adding leucine to a low-protein mixed drink could raise myofibrillar MPS toward the level of a larger protein dose in young men (Churchward-Venne et al., 2014). In older adults, Katsanos and colleagues found that a higher leucine proportion was required to stimulate MPS (Katsanos et al., 2006). Cuthbertson and colleagues described the underlying physiology as anabolic resistance: older muscle showed smaller MPS and anabolic-signalling responses to the same amino-acid dose (Cuthbertson et al., 2005). Drummond and colleagues reported that the anabolic response to exercise plus essential amino acids is delayed in older muscle (Drummond et al., 2008). Moore and colleagues quantified the meal-level consequence: the protein intake required to maximise myofibrillar MPS was about 0.24 g·kg−1 in young men and about 0.40 g·kg−1 in older men (Moore et al., 2015).
From those acute data a per-meal heuristic was built. Paddon-Jones argued for distributing protein across meals rather than concentrating it at dinner (Paddon-Jones et al., 2004). Loenneke and colleagues, in a cross-sectional analysis, associated more frequent meals containing 30–45 g of protein with greater lean mass and strength (Loenneke et al., 2016). Schoenfeld and Aragon reviewed the single-meal ceiling argument and concluded that a per-meal dose on the order of 0.4 g·kg−1, repeated across the day, is a defensible reading of the acute literature if the daily target is near 1.6 g·kg−1 (Schoenfeld and Aragon, 2018). Kim and colleagues later reported that, in older adults, daily distribution pattern did not change the anabolic response or lean-mass outcome when total protein was adequate (Kim et al., 2018). The distribution claim is therefore emerging: biologically tidy, supported by some acute and observational work, not confirmed as a necessary condition once the daily total is high enough.
08 Dieting and body composition
Energy deficit is the setting in which higher protein has its clearest human composition evidence. Wycherley and colleagues meta-analysed energy-restricted high-protein, low-fat diets against standard-protein, low-fat diets. The higher-protein arms lost more weight and more fat mass, retained more fat-free mass, and reduced triglycerides more (Wycherley et al., 2012). Krieger and colleagues, in an earlier meta-regression of diet composition, likewise found that higher protein (and lower carbohydrate) associated with more fat-free-mass retention during weight loss (Krieger et al., 2006). Santesso and colleagues’ systematic review of higher- versus lower-protein diets on health outcomes found modest improvements in weight, BMI, and some cardiometabolic markers, with heterogeneity (Santesso et al., 2012). These are human trial syntheses. They are strongly supported for short-to-medium-term composition under energy restriction. They are not demonstrations that a high-protein diet outperforms a calorie-matched Mediterranean pattern on ten-year coronary events.
Longland and colleagues ran the cleanest single trial on the interaction with training: during a marked energy deficit with intense exercise, 2.4 g·kg−1·d−1 produced lean-mass gain and greater fat loss, whereas 1.2 g·kg−1·d−1 produced lean-mass loss (Longland et al., 2016). Skov and colleagues, in an ad libitum fat-reduced trial, found that a higher-protein condition produced greater weight loss than a higher-carbohydrate comparison — an intake effect mediated partly by spontaneous energy reduction (Skov et al., 1999). Bray and colleagues reversed the sign of energy: in supervised overfeeding, protein content determined the change in lean mass more than the change in fat mass; fat gain tracked energy surplus (Bray et al., 2012). The pair of results is the energy-context rule in experimental form. Protein is not a calorie-free anabolic. In surplus it builds lean tissue and does not prevent fat gain. In deficit, with training, it is one of the few dietary levers that consistently changes the composition of the loss.
09 Optimum is not the RDA
Once the RDA is recognised as a nitrogen-balance floor (section 02), the remaining question is what “optimal” would even mean. Optimal for zero nitrogen is not optimal for fat-free mass during a cut, not optimal for gait speed at eighty, and not optimal for a powerlifter’s recovery. Wolfe reviewed dietary protein as a determinant of muscle mass and function and argued that intakes above the RDA are justified when the endpoint is muscle, particularly in older adults (Wolfe, 2012). Phillips made the same argument from the training literature (Phillips, 2016). Neither paper replaces the DRI process. Both papers refuse to treat 0.80 g·kg−1 as a target rather than a minimum.
An upper safe intake has not been set as a DRI tolerable upper intake level. The AMDR cap of 35% of energy is the nearest institutional ceiling (Trumbo et al., 2002). Antonio and colleagues fed resistance-trained men 3.4 g·kg−1·d−1 in one trial and, in a one-year crossover, very high protein intakes with no adverse change in the clinical chemistry they measured, including renal and hepatic panels (Antonio et al., 2015, 2016). Those are small, self-selected, trained, mostly male samples, with food logs rather than metabolic-ward control. They are evidence against an immediate toxicology signal at intakes far above the AMDR when expressed in g·kg−1. They are not a licence, and they are not a longevity study. Cuenca-Sánchez and colleagues reviewed the satiety, kidney, and bone controversies and concluded that the popular harms are overstated in healthy people and under-specified as to source and duration (Cuenca-Sánchez et al., 2015). That review is a map of the arguments, not a new trial.
10 Older adults and sarcopenia
Sarcopenia is now a defined syndrome — low muscle strength, with low muscle quantity or quality, and poor physical performance as a severity marker — not a synonym for aging (Cruz-Jentoft et al., 2019). The Health ABC cohort found that older community-dwelling adults in the highest quintile of energy-adjusted protein intake lost less lean mass over three years than those in the lowest quintile (Houston et al., 2008). That is prospective observational evidence. It is strongly supported as an association. It is not a randomised demonstration that raising protein prevents sarcopenia, and it cannot fully separate protein from the dietary pattern that carried it.
The PROT-AGE study group recommended 1.0–1.2 g·kg−1·d−1 for healthy older adults, 1.2–1.5 g·kg−1 in illness or malnutrition, and higher still in severe illness or injury, with per-meal protein of 25–30 g (Bauer et al., 2013). The ESPEN Expert Group made a congruent recommendation and added resistance exercise as a co-prescription for function (Deutz et al., 2014). Gregorio and colleagues reported that among post-menopausal women, protein intakes closer to 1.2 g·kg−1 associated with better physical performance than lower intakes (Gregorio et al., 2014). These documents are expert syntheses, not new RCTs. They exist because the RDA sample was not older muscle with anabolic resistance (Cuthbertson et al., 2005; Moore et al., 2015). The gap between 0.8 and 1.2 g·kg−1 in older adults is the most institutionally recognised “beyond RDA” claim in clinical nutrition. It remains a recommendation from societies, not a DRI revision.
| Source | Population | Design | Protein finding | Grade |
|---|---|---|---|---|
| Houston et al., 2008 | Health ABC, 70–79 y | Prospective cohort, 3 y | Highest vs lowest protein quintile: less lean-mass loss | Association, strongly supported |
| Cuthbertson et al., 2005 | Young vs older adults | Human tracer / signalling | Anabolic resistance to amino acids | Established mechanism |
| Moore et al., 2015 | Young vs older men | Acute dose–response MPS | ~0.24 vs ~0.40 g·kg−1 per meal to saturate | Established acute |
| Bauer et al., 2013 | Older adults (PROT-AGE) | Position paper | 1.0–1.2 g·kg−1 healthy; more if ill | Expert synthesis |
| Deutz et al., 2014 | Older adults (ESPEN) | Expert group | Protein plus resistance exercise for function | Expert synthesis |
| Cruz-Jentoft et al., 2019 | Clinical definition | Consensus | Sarcopenia is strength-first, not protein-defined | Established nosology |
| Gregorio et al., 2014 | Post-menopausal women | Cross-section | Higher protein, better performance | Emerging / confounded |
Aging and sarcopenia evidence table. Position papers are not trials. Cohort associations are not causal demonstrations.
11 Athletes and the upper range
Athletes are not a separate species of nitrogen metabolism. They are people who impose larger contractile and energetic loads and who often restrict energy while trying to hold lean mass. The ISSN range of 1.4–2.0 g·kg−1 (Jäger et al., 2017) and the Morton breakpoint near 1.6 g·kg−1 for fat-free-mass accretion (Morton et al., 2018) are the two most cited quantitative summaries. Helms’s review of lean, trained athletes in a deficit is the document that pushes toward the top of the range (Helms et al., 2014). Antonio’s very-high-protein series is the empirical ceiling-test in trained men (Antonio et al., 2015, 2016). None of these papers measured championship performance as a primary endpoint. “Recovery” in this literature usually means overnight MPS, next-day function, or fat-free mass, not a race time.
| Trial / synthesis | n / design | Protein contrast | Primary muscle result | Limit |
|---|---|---|---|---|
| Moore et al., 2009 | Young men, acute | 0–40 g egg after leg exercise | MPS plateau ~20 g | Hours, isolated limb |
| Witard et al., 2014 | Young men, acute | 0–40 g whey | Myofibrillar MPS near-max at 20 g | Hours |
| Macnaughton et al., 2016 | Young men, acute | 20 vs 40 g whey, whole-body | 40 g > 20 g | Hours |
| Areta et al., 2013 | Young men, 12 h | 80 g as 10 / 20 / 40 g pulses | 4×20 g highest integrated MPS | Not hypertrophy |
| Morton et al., 2018 | Meta-regression, RT | Supplement vs control | FFM breakpoint ~1.62 g·kg−1 | Heterogeneous programmes |
| Longland et al., 2016 | Young men, deficit + training | 2.4 vs 1.2 g·kg−1 | Lean gain vs lean loss | Short, male, intense |
| Antonio et al., 2015, 2016 | Trained men | ~3.4 g·kg−1; 1-year high protein | Composition / safety labs | Small, logged intake |
Sports and training matrix. Acute MPS rows are not interchangeable with fat-free-mass rows.
12 Bone is not dissolved by steak
The acid-ash hypothesis held that high-protein diets, especially from animal foods, generate a metabolic acid load that is buffered by bone, wasting calcium in urine and, over years, bone. Urinary calcium does rise with protein. Kerstetter and colleagues showed that the rise is accompanied by increased intestinal calcium absorption, so the net calcium economy is not a simple drain (Kerstetter et al., 2003, 2011). Darling and colleagues’ systematic review and meta-analysis found little evidence that higher protein harms bone density or fracture, and some evidence of benefit at the lumbar spine (Darling et al., 2009). Shams-White and colleagues, for the National Osteoporosis Foundation, likewise found that higher protein was associated with higher bone mineral density and a possible reduction in hip fracture risk, with the usual observational caveats (Shams-White et al., 2017). Fenton and colleagues’ systematic causal assessment of dietary acid load and bone disease did not support the acid-ash account of osteoporosis (Fenton et al., 2011). Calvez and colleagues reviewed protein, calcium balance, and health consequences and did not find a coherent skeletal indictment of higher protein in healthy adults (Calvez et al., 2012).
The bone claim against high-protein diets is therefore not established as a chronic harm in healthy adults. The remaining uncertainty is the usual one: very high protein with inadequate calcium, or protein as a marker for a dietary pattern that is also low in fruit, vegetables, and dairy, is a different exposure from protein in a mixed diet that meets calcium and alkali needs. That is source and pattern again, not grams.
13 The healthy kidney
A protein meal raises glomerular filtration rate. That is haemodynamic hyperfiltration, visible in human feeding trials, including the OmniHeart protein arm (Juraschek et al., 2013). Hyperfiltration is not the same event as a falling estimated GFR over years, and it is not the same event as a hard renal endpoint. Martin, Armstrong and Rodriguez reviewed dietary protein and renal function and did not find evidence that high-protein diets damage healthy kidneys (Martin et al., 2005). Poortmans and Dellalieux asked the same question in athletes and did not find a renal-risk signal from regular high-protein diets in that population (Poortmans and Dellalieux, 2000). Friedman reviewed potential kidney effects and distinguished healthy kidneys from diseased ones (Friedman, 2004).
Knight and colleagues, in the Nurses’ Health Study, found that higher protein intake was associated with faster GFR decline only in women who already had mild renal insufficiency; women with normal baseline function did not show that association (Knight et al., 2003). Devries and colleagues meta-analysed randomised comparisons of higher- versus lower-protein diets in healthy adults and found that changes in GFR did not differ (Devries et al., 2018). Antonio’s one-year high-protein crossover in trained men reported no harmful change in the renal panel they measured (Antonio et al., 2016). The healthy-kidney harm claim is therefore not established. The remaining honest reservation is duration and endpoint: few trials last a decade, and few measure hard renal outcomes rather than creatinine-based GFR.
14 Chronic kidney disease is a different exposure
Once nephron number is reduced, protein load is no longer a gym controversy. The Modification of Diet in Renal Disease trial tested protein restriction and blood-pressure control on CKD progression; the results were mixed and modest on GFR slope, and they have been re-analysed ever since (Klahr et al., 1994; Levey et al., 1999). Cochrane reviews of low-protein diets in non-diabetic CKD have reported uncertain effects on death and a possible delay of end-stage disease, with low-to-moderate certainty and adherence problems (Fouque and Laville, 2009; Hahn et al., 2018, 2020). The KDOQI 2020 nutrition guideline recommends protein restriction in metabolically stable adults with CKD 3–5 not on dialysis — 0.55–0.60 g·kg−1·d−1, or a very-low-protein diet plus ketoacid analogues under specialised care — and higher protein once dialysis begins (Ikizler et al., 2020). Those numbers are guideline parameters, not a lifestyle prescription for people without CKD.
The analytical error this section exists to prevent is the transfer of the CKD restriction into the healthy-adult argument, and the reverse transfer of gym safety data into the nephrology clinic. They are not the same patients, not the same residual nephron mass, and not the same endpoints.
| Evidence | Kidneys | Design | Result | Does not show |
|---|---|---|---|---|
| Juraschek et al., 2013 | Healthy (OmniHeart) | RCT feeding | Higher protein raised GFR (hyperfiltration) | Chronic injury |
| Devries et al., 2018 | Healthy adults | RCT meta-analysis | GFR change not different, higher vs lower protein | Decade-long hard endpoints |
| Knight et al., 2003 | Nurses; normal vs mild insufficiency | Prospective | Faster decline only if baseline GFR already reduced | Causation in healthy kidneys |
| Martin et al., 2005; Poortmans, 2000 | Healthy / athletes | Reviews | No clear damage signal | CKD safety |
| Klahr et al., 1994; Levey et al., 1999 | CKD (MDRD) | RCT | Modest / mixed GFR-slope effect | A simple yes/no |
| Fouque 2009; Hahn 2018, 2020 | Non-diabetic CKD | Cochrane | Uncertain mortality; possible ESRD delay | High certainty |
| Ikizler et al., 2020 | CKD 3–5, not on dialysis | KDOQI guideline | Protein restriction in stable patients | A rule for healthy adults |
Renal evidence table. Hyperfiltration, eGFR slope, and dialysis are three different outcomes.
15 Liver and nitrogen disposal
The liver is the organ that converts leftover amino-nitrogen to urea. A high-protein meal increases ureagenesis; that is physiology, not hepatitis. In people with established cirrhosis and a history of hepatic encephalopathy, protein handling is a clinical problem of a different order, and this article does not treat that problem as a general-population finding. In healthy adults, including Antonio’s very-high-protein trained men, routine hepatic enzymes have not announced a toxicology signal (Antonio et al., 2016). Absence of a signal in small athletic samples is not a proof of lifelong hepatic indifference. It is the evidence that exists.
16 Glucose metabolism
Protein is insulinotropic and, in people with type 2 diabetes, can flatten postprandial glucose when it replaces carbohydrate. Gannon and Nuttall reported that raising protein and lowering carbohydrate improved 24-hour glucose in human feeding studies of type 2 diabetes (Gannon and Nuttall, 2003). OmniHeart’s protein arm, relative to a high-carbohydrate arm, improved blood pressure and some lipid measures; insulin-sensitivity results in later OmniHeart analyses were not a simple protein victory (Appel et al., 2005; Furtado et al., 2008; Gadgil et al., 2013). The substitution rule is mandatory: protein that replaces refined carbohydrate is not protein that replaces unsaturated fat, and neither is protein added on top of an unchanged diet. Claims that high-protein diets “cause insulin resistance” in healthy humans are not established by the controlled-feeding literature at ordinary elevated intakes. Claims that they are a diabetes therapy are also not established beyond short feeding studies and weight-loss trials in which energy deficit does most of the work.
17 Cardiovascular outcomes
Randomised evidence that isolates protein quantity and follows hard cardiovascular events does not exist at meaningful duration. What exists is substitution feeding and source epidemiology. OmniHeart found that replacing carbohydrate with protein (or with monounsaturated fat) lowered blood pressure and improved lipids relative to a high-carbohydrate DASH-like diet (Appel et al., 2005; Furtado et al., 2008). Santesso’s higher- versus lower-protein systematic review found modest cardiometabolic movement without a hard-event result (Santesso et al., 2012). Bernstein and colleagues, in the Nurses’ Health Study, reported that the protein source predicted coronary disease: higher red-meat protein associated with more CHD, higher nut, fish, and poultry protein with less, when substitution was modelled (Bernstein et al., 2010). Zhong and colleagues associated processed meat and unprocessed red meat, but not poultry or fish, with incident cardiovascular disease in a large US cohort (Zhong et al., 2020).
Low-carbohydrate scores that are high in animal protein and animal fat have a different observational record from plant-forward low-carbohydrate scores. Halton and colleagues found that a low-carbohydrate-diet score was not associated with higher CHD in women when vegetable sources were emphasised (Halton et al., 2006). Seidelmann and colleagues reported a U-shaped association of carbohydrate intake with mortality, with both very low and very high carbohydrate associated with higher death, and with plant-derived low-carbohydrate patterns faring better than animal-derived ones (Seidelmann et al., 2018). The PURE study reported that higher carbohydrate and lower fat associated with higher mortality across 18 countries — a result that is not a protein trial and that remains contested on residual confounding and diet-assessment grounds (Dehghan et al., 2017). None of these papers is a randomised test of 1.6 versus 0.8 g·kg−1 on myocardial infarction.
18 Mortality
Song and colleagues, in two large US cohorts, found that higher animal-protein intake associated with higher cardiovascular mortality and that higher plant-protein intake associated with lower all-cause and cardiovascular mortality; substitution models drove the interpretation (Song et al., 2016). Naghshi and colleagues’ dose–response meta-analysis of prospective studies found that higher total protein and higher plant protein associated with lower all-cause mortality, while animal protein was not significantly associated with mortality in the main analysis (Naghshi et al., 2020). Chen and colleagues, in the Rotterdam Study, reported source-specific associations that again refused to treat “protein” as one exposure (Chen et al., 2020). Levine and colleagues reported that, among adults aged 50–65 in NHANES, higher protein associated with higher IGF-1 and with higher cancer and overall mortality, an association that inverted after age 65 (Levine et al., 2014). That paper is the most cited exhibit for a high-protein longevity harm. It is observational, age-split, and entangled with source; its mouse experiments are mouse experiments. It is emerging as a hypothesis generator and not established as a causal human aging result.
19 A gram of protein arrives inside a food
Every number in the first four parts was a quantity of protein or of an amino acid. A person does not eat a quantity of protein. They eat beef, milk, eggs, lentils, a whey shake, or a slice of ham, and the protein arrives inside a matrix that the gram does not describe. Two foods matched to the same grams of protein can differ in amino-acid pattern, in digestibility, and in everything else they carry — the heme iron and saturated fat of red meat, the curing salts of a processed product, the fibre and isoflavones of a legume. The food carries a matrix; the gram does not. Source is therefore a fifth axis, independent of the four units of intake, and it is the axis on which most of the chronic-disease argument actually turns.
The amino-acid axis is measurable. Animal proteins supply the nine indispensable amino acids in proportions close to human requirement and are highly digestible; most single plant proteins are lower in one or more indispensable amino acids — lysine in cereals, methionine in legumes — and their digestibility is reduced by fibre and antinutrients. That difference is visible in the acute muscle-protein-synthesis literature that Part Two graded. Whey, a fast leucine-rich dairy fraction, is absorbed more rapidly than casein and drives a sharper postprandial rise in whole-body protein synthesis (Boirie et al., 1997); at a matched dose it raises myofibrillar synthesis more than casein or soy (Tang et al., 2009), and fluid skim milk supported greater muscle protein accretion than a soy drink after resistance exercise (Wilkinson et al., 2007). Katsanos and colleagues showed that a high proportion of leucine is required to drive synthesis in older muscle (Katsanos et al., 2006). Those are strongly supported acute mechanistic facts. They are not a ranking of foods for health, and the leucine advantage of whey does not travel to a cardiovascular endpoint.
20 Source-specific epidemiology
When protein is followed as a food rather than as a nutrient, the associations separate by source in a consistent direction. In the Nurses’ Health Study, Bernstein and colleagues modelled substitution and found that protein from red meat associated with more coronary heart disease, while protein from nuts, fish, and poultry associated with less (Bernstein et al., 2010). Pan and colleagues, across two large US cohorts, associated red-meat intake — processed more strongly than unprocessed — with higher total mortality (Pan et al., 2012), and Zheng and colleagues later reported that increasing red-meat consumption over time associated with higher subsequent mortality (Zheng et al., 2019). Zhong and colleagues separated the sources directly: processed meat and unprocessed red meat, but not poultry or fish, associated with incident cardiovascular disease and death (Zhong et al., 2020). Eggs, treated as their own exposure across three cohorts, were not associated with cardiovascular risk at moderate intake (Drouin-Chartier et al., 2020).
The plant side of the same ledger runs the other way, though Part Four’s mortality section already recorded the endpoint: higher plant-protein intake tracked lower all-cause and cardiovascular mortality across the same cohorts and meta-analysis that found animal protein flat or adverse (Song et al., 2016; Naghshi et al., 2020). What those studies leave for a source section is the non-mortality, food-specific signal. Soy has its own controlled record: it modestly lowers LDL cholesterol in the FDA-reviewed trial set (Blanco Mejia et al., 2019) and carries no demonstrated adult harm in a large clinical and epidemiologic review (Messina, 2016). On cancer, Farvid and colleagues associated red and processed meat — not protein in the abstract — with higher breast-cancer incidence (Farvid et al., 2018). The signal keeps attaching to the food.
Two cautions hold this section together. First, every one of these is an observational substitution model; the effect is the estimated consequence of exchanging one source for another at constant energy, and residual confounding by fibre, processing, and the health behaviours that travel with meat avoidance is not removed by adjustment. Second, none of these studies isolates protein quantity. They are the strongest evidence that source matters and among the weakest possible evidence about whether 1.6 versus 0.8 g·kg−1 matters when source is held constant.
| Source | Load-bearing evidence | Design | Direction | Grade / does not show |
|---|---|---|---|---|
| Processed meat | Pan 2012; Zhong 2020; Farvid 2018 | Prospective cohorts | Higher CVD, mortality, breast cancer | MODERATE association; not a randomised causal test |
| Unprocessed red meat | Bernstein 2010; Pan 2012; Zheng 2019 | Prospective cohorts | Higher CHD, mortality; dose- and change-dependent | MODERATE; weaker than processed |
| Poultry / fish | Bernstein 2010; Zhong 2020 | Prospective cohorts | Neutral to favourable on substitution | LIMITED; substitution-model dependent |
| Egg | Drouin-Chartier 2020 | Three cohorts | No CVD association at moderate intake | MODERATE null; not a high-intake licence |
| Plant / soy / legume | Song 2016; Naghshi 2020; Blanco Mejia 2019; Messina 2016 | Cohorts + RCT meta | Lower all-cause mortality; modest LDL fall | MODERATE; confounded by whole diet |
Source epidemiology matrix. Every row is a substitution association at constant energy, not a test of protein quantity.
21 IGF-1, mTOR, and the longevity argument
The strongest theoretical case against high protein is not renal and not cardiovascular. It is the growth-signalling argument: dietary protein, and leucine in particular, activates the mechanistic target of rapamycin (mTOR) and raises insulin-like growth factor 1 (IGF-1), and reduced nutrient-sensing signalling is one of the more reproducible ways to extend lifespan in model organisms. Saxton and Sabatini’s review sets out mTOR as the central controller of growth and metabolism (Saxton and Sabatini, 2017). The inference under examination is that a pathway which promotes growth must, chronically driven, shorten life.
Two results are used to carry that inference into humans, and neither closes it. Levine and colleagues reported that, among NHANES adults aged 50–65, higher protein intake associated with higher IGF-1 and with higher cancer and overall mortality — an association that reversed after age 65, where higher protein tracked lower mortality (Levine et al., 2014). Part Four already graded that paper as observational, age-split, and entangled with animal source; what it contributes to the mechanism argument is the mouse tumour-xenograft work in the same report, which shows IGF-1-dependent tumour growth in animals, not shortened life in people. A mouse study published in the same issue, Solon-Biet and colleagues, found that low-protein high-carbohydrate diets extended median lifespan and improved cardiometabolic markers in mice fed ad libitum — a result about macronutrient ratio in a caged rodent, not a human protein prescription (Solon-Biet et al., 2014).
The honest reading distinguishes three claims that the slogan fuses. That protein raises mTOR and IGF-1 acutely is established biochemistry. That lower lifelong nutrient-sensing signalling extends lifespan in mice and other short-lived models is strongly supported in those organisms. That eating more protein shortens human life is emerging at most — a hypothesis generated by age-stratified observational data and animal work, confounded by source, and directly opposed by the same literature’s finding that higher protein protects older adults. A kinase that builds muscle in a seventy-year-old is being read as a death certificate on the strength of a mouse and an age-stratified survey. The reading does not hold.
The same fusion drives the high-protein low-carbohydrate diet, where raising protein cannot be separated from cutting carbohydrate. As a short-horizon tool the record is real: Skov and colleagues found that a higher-protein ad libitum diet produced more weight loss than a higher-carbohydrate one at matched fat (Skov et al., 1999), and Wycherley and colleagues’ meta-analysis of energy-restricted high-protein low-fat diets found modestly greater loss of weight and fat with better retention of lean mass (Wycherley et al., 2012). What that record cannot settle is the long horizon, because a low-carbohydrate pattern is defined by its replacement — Part Four found that animal-based and plant-based low-carbohydrate scores diverge, the plant-forward version faring better. It is a weight and glycaemic instrument with a short evidence horizon, not a demonstrated longevity strategy in either direction.
22 The strongest case, and the strongest caution
Put the two kinds of evidence side by side. The strongest case for benefit is short-to-medium-term and mechanistically clean: under an energy deficit, higher protein preserves lean mass and favours fat loss (Longland et al., 2016; Wycherley et al., 2012), and combined with resistance training it produces measurably greater gains in lean mass and strength up to roughly 1.6 g·kg−1·d−1, above which the average marginal return flattens (Morton et al., 2018). In older adults, who face anabolic resistance and sarcopenia, intakes above the RDA are associated with better lean mass and physical function, and expert groups converge on roughly 1.0–1.2 g·kg−1·d−1 as a floor for that population (Bauer et al., 2013; Deutz et al., 2014; Phillips et al., 2016). None of this requires a supplement or a particular source; it requires enough total protein, distributed across meals, in someone who trains.
The strongest case for caution is long-horizon and source-specific. It is not a demonstrated renal toxin in healthy kidneys, which Part Four graded not established (Devries et al., 2018), and it is not a proven human longevity harm from protein quantity. It is the consistent observational association of processed and unprocessed red meat with cardiovascular disease, some cancers, and mortality (Pan et al., 2012; Zhong et al., 2020; Farvid et al., 2018), set against the inverse association of plant protein (Song et al., 2016; Naghshi et al., 2020) — and, separately and firmly, the guideline restriction of protein load in established chronic kidney disease (Ikizler et al., 2020). The caution attaches to the food and to the patient, not to the gram.
A high-protein diet is defensible where the evidence is strongest — a trained or older adult, an energy deficit, total protein toward 1.6 g·kg−1·d−1, sources weighted toward fish, dairy, eggs, legumes, and poultry rather than processed meat. It is least supported where the claims are loudest — as a longevity intervention, a renal danger in healthy people, or a reason to treat every gram as interchangeable. Quantity is not source; acute synthesis is not lifespan; the healthy kidney is not the diseased one; and the food is not the gram.
23 Evidence handling
Peer-reviewed identifiers were verified against NCBI PubMed records, not reproduced from memory. In-prose citations are author–year; the numbered list is sorted by first-author surname. The study design is named in the sentence that reports each finding. Animal and cell results are not restated as human outcomes, and the mouse macronutrient-geometry and tumour-xenograft experiments are labelled as such wherever the longevity argument leans on them. Epidemiological associations are reported as substitution models at constant energy, not as demonstrated causes, and residual confounding by processing, fibre, and the health behaviours that travel with meat avoidance is named rather than adjusted away. Guideline text — the KDOQI renal recommendation and the Institute of Medicine reference intakes — is quoted as recommendation language, not as trial evidence. Where two exposures share a name — protein the nutrient and the food that carries it, the healthy kidney and the diseased one, acute synthesis and lifespan — they are kept apart. Only peer-reviewed literature and named guideline and agency sources are cited; general reference databases were used to locate that literature, never as evidence in their own right.
24 Scope relative to sibling articles
This is the high-protein-diet article in the SBL-41 series. It is not the amino-acid nutrition framework article, which orients requirements at the level of individual amino acids, and it is not the protein-supplements article, which treats isolated powders as products. It is not a sports-nutrition fuelling guide, a weight-loss-diet manual, or a clinical nutrition-support protocol. Chronic kidney disease appears only to forbid the transfer of its protein restriction onto healthy adults, and the reverse transfer of athletic-safety data into the nephrology clinic; this document is not a nephrology reference.
25 References
99 peer-reviewed records below were verified against NCBI. In-prose citations use author–year; where a first author appears twice in the same year, the text distinguishes the two by subject.
- Antonio J, Ellerbroek A, Silver T, Orris S, Scheiner M, Gonzalez A, et al.. A high protein diet (3.4 g/kg/d) combined with a heavy resistance training program improves body composition in healthy trained men and women--a follow-up investigation. J Int Soc Sports Nutr. 2015;12:39.
PMID 26500462 · doi:10.1186/s12970-015-0100-0 · PMC4617900 - Antonio J, Ellerbroek A, Silver T, Vargas L, Tamayo A, Buehn R, et al.. A High Protein Diet Has No Harmful Effects: A One-Year Crossover Study in Resistance-Trained Males. J Nutr Metab. 2016;2016:9104792.
PMID 27807480 · doi:10.1155/2016/9104792 · PMC5078648 - Appel LJ, Sacks FM, Carey VJ, Obarzanek E, Swain JF, Miller ER, et al.. Effects of protein, monounsaturated fat, and carbohydrate intake on blood pressure and serum lipids: results of the OmniHeart randomized trial. JAMA. 2005;294(19):2455-64.
PMID 16287956 · doi:10.1001/jama.294.19.2455 - Aragon AA, Schoenfeld BJ, Wildman R, Kleiner S, VanDusseldorp T, Taylor L, et al.. International society of sports nutrition position stand: diets and body composition. J Int Soc Sports Nutr. 2017;14:16.
PMID 28630601 · doi:10.1186/s12970-017-0174-y · PMC5470183 - Areta JL, Burke LM, Ross ML, Camera DM, West DW, Broad EM, et al.. Timing and distribution of protein ingestion during prolonged recovery from resistance exercise alters myofibrillar protein synthesis. J Physiol. 2013;591(9):2319-31.
PMID 23459753 · doi:10.1113/jphysiol.2012.244897 · PMC3650697 - Bauer J, Biolo G, Cederholm T, Cesari M, Cruz-Jentoft AJ, Morley JE, et al.. Evidence-based recommendations for optimal dietary protein intake in older people: a position paper from the PROT-AGE Study Group. J Am Med Dir Assoc. 2013;14(8):542-59.
PMID 23867520 · doi:10.1016/j.jamda.2013.05.021 - Bernstein AM, Sun Q, Hu FB, Stampfer MJ, Manson JE, Willett WC. Major dietary protein sources and risk of coronary heart disease in women. Circulation. 2010;122(9):876-83.
PMID 20713902 · doi:10.1161/CIRCULATIONAHA.109.915165 · PMC2946797 - Blanco Mejia S, Messina M, Li SS, Viguiliouk E, Chiavaroli L, Khan TA, et al.. A Meta-Analysis of 46 Studies Identified by the FDA Demonstrates that Soy Protein Decreases Circulating LDL and Total Cholesterol Concentrations in Adults. J Nutr. 2019;149(6):968-981.
PMID 31006811 · doi:10.1093/jn/nxz020 · PMC6543199 - Blom WA, Lluch A, Stafleu A, Vinoy S, Holst JJ, Schaafsma G, et al.. Effect of a high-protein breakfast on the postprandial ghrelin response. Am J Clin Nutr. 2006;83(2):211-20.
PMID 16469977 · doi:10.1093/ajcn/83.2.211 - Boirie Y, Dangin M, Gachon P, Vasson MP, Maubois JL, Beaufrère B. Slow and fast dietary proteins differently modulate postprandial protein accretion. Proc Natl Acad Sci U S A. 1997;94(26):14930-5.
PMID 9405716 · doi:10.1073/pnas.94.26.14930 · PMC25140 - Bray GA, Smith SR, de Jonge L, Xie H, Rood J, Martin CK, et al.. Effect of dietary protein content on weight gain, energy expenditure, and body composition during overeating: a randomized controlled trial. JAMA. 2012;307(1):47-55.
PMID 22215165 · doi:10.1001/jama.2011.1918 · PMC3777747 - Calvez J, Poupin N, Chesneau C, Lassale C, Tomé D. Protein intake, calcium balance and health consequences. Eur J Clin Nutr. 2012;66(3):281-95.
PMID 22127335 · doi:10.1038/ejcn.2011.196 - Chen Z, Glisic M, Song M, Aliahmad HA, Zhang X, Moumdjian AC, et al.. Dietary protein intake and all-cause and cause-specific mortality: results from the Rotterdam Study and a meta-analysis of prospective cohort studies. Eur J Epidemiol. 2020;35(5):411-429.
PMID 32076944 · doi:10.1007/s10654-020-00607-6 · PMC7250948 - Churchward-Venne TA, Breen L, Di Donato DM, Hector AJ, Mitchell CJ, Moore DR, et al.. Leucine supplementation of a low-protein mixed macronutrient beverage enhances myofibrillar protein synthesis in young men: a double-blind, randomized trial. Am J Clin Nutr. 2014;99(2):276-86.
PMID 24284442 · doi:10.3945/ajcn.113.068775 - Courtney-Martin G, Ball RO, Pencharz PB, Elango R. Protein Requirements during Aging. Nutrients. 2016;8(8).
PMID 27529275 · doi:10.3390/nu8080492 · PMC4997405 - Cruz-Jentoft AJ, Bahat G, Bauer J, Boirie Y, Bruyère O, Cederholm T, et al.. Sarcopenia: revised European consensus on definition and diagnosis. Age Ageing. 2019;48(1):16-31.
PMID 30312372 · doi:10.1093/ageing/afy169 · PMC6322506 - Cuenca-Sánchez M, Navas-Carrillo D, Orenes-Piñero E. Controversies surrounding high-protein diet intake: satiating effect and kidney and bone health. Adv Nutr. 2015;6(3):260-6.
PMID 25979491 · doi:10.3945/an.114.007716 · PMC4424780 - Cuthbertson D, Smith K, Babraj J, Leese G, Waddell T, Atherton P, et al.. Anabolic signaling deficits underlie amino acid resistance of wasting, aging muscle. FASEB J. 2005;19(3):422-4.
PMID 15596483 · doi:10.1096/fj.04-2640fje - Darling AL, Millward DJ, Torgerson DJ, Hewitt CE, Lanham-New SA. Dietary protein and bone health: a systematic review and meta-analysis. Am J Clin Nutr. 2009;90(6):1674-92.
PMID 19889822 · doi:10.3945/ajcn.2009.27799 - Dehghan M, Mente A, Zhang X, Swaminathan S, Li W, Mohan V, et al.. Associations of fats and carbohydrate intake with cardiovascular disease and mortality in 18 countries from five continents (PURE): a prospective cohort study. Lancet. 2017;390(10107):2050-2062.
PMID 28864332 · doi:10.1016/S0140-6736(17)32252-3 - Deutz NE, Bauer JM, Barazzoni R, Biolo G, Boirie Y, Bosy-Westphal A, et al.. Protein intake and exercise for optimal muscle function with aging: recommendations from the ESPEN Expert Group. Clin Nutr. 2014;33(6):929-36.
PMID 24814383 · doi:10.1016/j.clnu.2014.04.007 · PMC4208946 - Devries MC, Sithamparapillai A, Brimble KS, Banfield L, Morton RW, Phillips SM. Changes in Kidney Function Do Not Differ between Healthy Adults Consuming Higher- Compared with Lower- or Normal-Protein Diets: A Systematic Review and Meta-Analysis. J Nutr. 2018;148(11):1760-1775.
PMID 30383278 · doi:10.1093/jn/nxy197 · PMC6236074 - Drouin-Chartier JP, Chen S, Li Y, Schwab AL, Stampfer MJ, Sacks FM, et al.. Egg consumption and risk of cardiovascular disease: three large prospective US cohort studies, systematic review, and updated meta-analysis. BMJ. 2020;368:m513.
PMID 32132002 · doi:10.1136/bmj.m513 · PMC7190072 - Drummond MJ, Dreyer HC, Pennings B, Fry CS, Dhanani S, Dillon EL, et al.. Skeletal muscle protein anabolic response to resistance exercise and essential amino acids is delayed with aging. J Appl Physiol (1985). 2008;104(5):1452-61.
PMID 18323467 · doi:10.1152/japplphysiol.00021.2008 · PMC2715298 - Elango R, Ball RO, Pencharz PB. Indicator amino acid oxidation: concept and application. J Nutr. 2008;138(2):243-6.
PMID 18203885 · doi:10.1093/jn/138.2.243 - Farvid MS, Stern MC, Norat T, Sasazuki S, Vineis P, Weijenberg MP, et al.. Consumption of red and processed meat and breast cancer incidence: A systematic review and meta-analysis of prospective studies. Int J Cancer. 2018;143(11):2787-2799.
PMID 30183083 · doi:10.1002/ijc.31848 · PMC8985652 - Fenton TR, Tough SC, Lyon AW, Eliasziw M, Hanley DA. Causal assessment of dietary acid load and bone disease: a systematic review & meta-analysis applying Hill's epidemiologic criteria for causality. Nutr J. 2011;10:41.
PMID 21529374 · doi:10.1186/1475-2891-10-41 · PMC3114717 - Fouque D, Laville M. Low protein diets for chronic kidney disease in non diabetic adults. Cochrane Database Syst Rev. 2009:CD001892.
PMID 19588328 · doi:10.1002/14651858.CD001892.pub3 - Friedman AN. High-protein diets: potential effects on the kidney in renal health and disease. Am J Kidney Dis. 2004;44(6):950-62.
PMID 15558517 · doi:10.1053/j.ajkd.2004.08.020 - Furtado JD, Campos H, Appel LJ, Miller ER, Laranjo N, Carey VJ, et al.. Effect of protein, unsaturated fat, and carbohydrate intakes on plasma apolipoprotein B and VLDL and LDL containing apolipoprotein C-III: results from the OmniHeart Trial. Am J Clin Nutr. 2008;87(6):1623-30.
PMID 18541549 · doi:10.1093/ajcn/87.6.1623 · PMC2494528 - Gadgil MD, Appel LJ, Yeung E, Anderson CA, Sacks FM, Miller ER. The effects of carbohydrate, unsaturated fat, and protein intake on measures of insulin sensitivity: results from the OmniHeart trial. Diabetes Care. 2013;36(5):1132-7.
PMID 23223345 · doi:10.2337/dc12-0869 · PMC3631872 - Gannon MC, Nuttall FQ, Saeed A, Jordan K, Hoover H. An increase in dietary protein improves the blood glucose response in persons with type 2 diabetes. Am J Clin Nutr. 2003;78(4):734-41.
PMID 14522731 · doi:10.1093/ajcn/78.4.734 - Gosby AK, Conigrave AD, Raubenheimer D, Simpson SJ. Protein leverage and energy intake. Obes Rev. 2014;15(3):183-91.
PMID 24588967 · doi:10.1111/obr.12131 - Gregorio L, Brindisi J, Kleppinger A, Sullivan R, Mangano KM, Bihuniak JD, et al.. Adequate dietary protein is associated with better physical performance among post-menopausal women 60-90 years. J Nutr Health Aging. 2014;18(2):155-60.
PMID 24522467 · doi:10.1007/s12603-013-0391-2 · PMC4433492 - Hahn D, Hodson EM, Fouque D. Low protein diets for non-diabetic adults with chronic kidney disease. Cochrane Database Syst Rev. 2018;10(10):CD001892.
PMID 30284724 · doi:10.1002/14651858.CD001892.pub4 · PMC6517211 - Hahn D, Hodson EM, Fouque D. Low protein diets for non-diabetic adults with chronic kidney disease. Cochrane Database Syst Rev. 2020;10(10):CD001892.
PMID 33118160 · doi:10.1002/14651858.CD001892.pub5 · PMC8095031 - Halton TL, Hu FB. The effects of high protein diets on thermogenesis, satiety and weight loss: a critical review. J Am Coll Nutr. 2004;23(5):373-85.
PMID 15466943 · doi:10.1080/07315724.2004.10719381 - Halton TL, Willett WC, Liu S, Manson JE, Albert CM, Rexrode K, et al.. Low-carbohydrate-diet score and the risk of coronary heart disease in women. N Engl J Med. 2006;355(19):1991-2002.
PMID 17093250 · doi:10.1056/NEJMoa055317 - Helms ER, Zinn C, Rowlands DS, Brown SR. A systematic review of dietary protein during caloric restriction in resistance trained lean athletes: a case for higher intakes. Int J Sport Nutr Exerc Metab. 2014;24(2):127-38.
PMID 24092765 · doi:10.1123/ijsnem.2013-0054 - Houston DK, Nicklas BJ, Ding J, Harris TB, Tylavsky FA, Newman AB, et al.. Dietary protein intake is associated with lean mass change in older, community-dwelling adults: the Health, Aging, and Body Composition (Health ABC) Study. Am J Clin Nutr. 2008;87(1):150-5.
PMID 18175749 · doi:10.1093/ajcn/87.1.150 - Ikizler TA, Burrowes JD, Byham-Gray LD, Campbell KL, Carrero JJ, Chan W, et al.. KDOQI Clinical Practice Guideline for Nutrition in CKD: 2020 Update. Am J Kidney Dis. 2020;76(3 Suppl 1):S1-S107.
PMID 32829751 · doi:10.1053/j.ajkd.2020.05.006 - Juraschek SP, Appel LJ, Anderson CA, Miller ER. Effect of a high-protein diet on kidney function in healthy adults: results from the OmniHeart trial. Am J Kidney Dis. 2013;61(4):547-54.
PMID 23219108 · doi:10.1053/j.ajkd.2012.10.017 · PMC3602135 - Jäger R, Kerksick CM, Campbell BI, Cribb PJ, Wells SD, Skwiat TM, et al.. International Society of Sports Nutrition Position Stand: protein and exercise. J Int Soc Sports Nutr. 2017;14:20.
PMID 28642676 · doi:10.1186/s12970-017-0177-8 · PMC5477153 - Katsanos CS, Kobayashi H, Sheffield-Moore M, Aarsland A, Wolfe RR. A high proportion of leucine is required for optimal stimulation of the rate of muscle protein synthesis by essential amino acids in the elderly. Am J Physiol Endocrinol Metab. 2006;291(2):E381-7.
PMID 16507602 · doi:10.1152/ajpendo.00488.2005 - Kerstetter JE, O'Brien KO, Insogna KL. Dietary protein, calcium metabolism, and skeletal homeostasis revisited. Am J Clin Nutr. 2003;78(3 Suppl):584S-592S.
PMID 12936953 · doi:10.1093/ajcn/78.3.584S - Kerstetter JE, Kenny AM, Insogna KL. Dietary protein and skeletal health: a review of recent human research. Curr Opin Lipidol. 2011;22(1):16-20.
PMID 21102327 · doi:10.1097/MOL.0b013e3283419441 · PMC4659357 - Kim IY, Schutzler S, Schrader AM, Spencer HJ, Azhar G, Wolfe RR, et al.. Protein intake distribution pattern does not affect anabolic response, lean body mass, muscle strength or function over 8 weeks in older adults: A randomized-controlled trial. Clin Nutr. 2018;37(2):488-493.
PMID 28318687 · doi:10.1016/j.clnu.2017.02.020 · PMC9252263 - Kim IY, Shin YA, Schutzler SE, Azhar G, Wolfe RR, Ferrando AA. Quality of meal protein determines anabolic response in older adults. Clin Nutr. 2018;37(6 Pt A):2076-2083.
PMID 29066101 · doi:10.1016/j.clnu.2017.09.025 · PMC9987475 - Klahr S, Levey AS, Beck GJ, Caggiula AW, Hunsicker L, Kusek JW, et al.. The effects of dietary protein restriction and blood-pressure control on the progression of chronic renal disease. Modification of Diet in Renal Disease Study Group. N Engl J Med. 1994;330(13):877-84.
PMID 8114857 · doi:10.1056/NEJM199403313301301 - Knight EL, Stampfer MJ, Hankinson SE, Spiegelman D, Curhan GC. The impact of protein intake on renal function decline in women with normal renal function or mild renal insufficiency. Ann Intern Med. 2003;138(6):460-7.
PMID 12639078 · doi:10.7326/0003-4819-138-6-200303180-00009 - Krieger JW, Sitren HS, Daniels MJ, Langkamp-Henken B. Effects of variation in protein and carbohydrate intake on body mass and composition during energy restriction: a meta-regression 1. Am J Clin Nutr. 2006;83(2):260-74.
PMID 16469983 · doi:10.1093/ajcn/83.2.260 - Leidy HJ. Increased dietary protein as a dietary strategy to prevent and/or treat obesity. Mo Med. 2014;111(1):54-8.
PMID 24645300 · PMC6179508 - Leidy HJ, Clifton PM, Astrup A, Wycherley TP, Westerterp-Plantenga MS, Luscombe-Marsh ND, et al.. The role of protein in weight loss and maintenance. Am J Clin Nutr. 2015;101(6):1320S-1329S.
PMID 25926512 · doi:10.3945/ajcn.114.084038 - Lejeune MP, Westerterp KR, Adam TC, Luscombe-Marsh ND, Westerterp-Plantenga MS. Ghrelin and glucagon-like peptide 1 concentrations, 24-h satiety, and energy and substrate metabolism during a high-protein diet and measured in a respiration chamber. Am J Clin Nutr. 2006;83(1):89-94.
PMID 16400055 · doi:10.1093/ajcn/83.1.89 - Levey AS, Greene T, Beck GJ, Caggiula AW, Kusek JW, Hunsicker LG, et al.. Dietary protein restriction and the progression of chronic renal disease: what have all of the results of the MDRD study shown? Modification of Diet in Renal Disease Study group. J Am Soc Nephrol. 1999;10(11):2426-39.
PMID 10541304 · doi:10.1681/ASN.V10112426 - Levine ME, Suarez JA, Brandhorst S, Balasubramanian P, Cheng CW, Madia F, et al.. Low protein intake is associated with a major reduction in IGF-1, cancer, and overall mortality in the 65 and younger but not older population. Cell Metab. 2014;19(3):407-17.
PMID 24606898 · doi:10.1016/j.cmet.2014.02.006 · PMC3988204 - Loenneke JP, Loprinzi PD, Murphy CH, Phillips SM. Per meal dose and frequency of protein consumption is associated with lean mass and muscle performance. Clin Nutr. 2016;35(6):1506-1511.
PMID 27086196 · doi:10.1016/j.clnu.2016.04.002 - Longland TM, Oikawa SY, Mitchell CJ, Devries MC, Phillips SM. Higher compared with lower dietary protein during an energy deficit combined with intense exercise promotes greater lean mass gain and fat mass loss: a randomized trial. Am J Clin Nutr. 2016;103(3):738-46.
PMID 26817506 · doi:10.3945/ajcn.115.119339 - Macnaughton LS, Wardle SL, Witard OC, McGlory C, Hamilton DL, Jeromson S, et al.. The response of muscle protein synthesis following whole-body resistance exercise is greater following 40 g than 20 g of ingested whey protein. Physiol Rep. 2016;4(15).
PMID 27511985 · doi:10.14814/phy2.12893 · PMC4985555 - Martin WF, Armstrong LE, Rodriguez NR. Dietary protein intake and renal function. Nutr Metab (Lond). 2005;2:25.
PMID 16174292 · doi:10.1186/1743-7075-2-25 · PMC1262767 - Messina M. Soy and Health Update: Evaluation of the Clinical and Epidemiologic Literature. Nutrients. 2016;8(12).
PMID 27886135 · doi:10.3390/nu8120754 · PMC5188409 - Millward DJ. Optimal intakes of protein in the human diet. Proc Nutr Soc. 1999;58(2):403-13.
PMID 10466184 · doi:10.1017/s0029665199000531 - Millward DJ. Protein and amino acid requirements of adults: current controversies. Can J Appl Physiol. 2001;26 Suppl:S130-40.
PMID 11897889 · doi:10.1139/h2001-048 - Moore DR, Robinson MJ, Fry JL, Tang JE, Glover EI, Wilkinson SB, et al.. Ingested protein dose response of muscle and albumin protein synthesis after resistance exercise in young men. Am J Clin Nutr. 2009;89(1):161-8.
PMID 19056590 · doi:10.3945/ajcn.2008.26401 - Moore DR, Churchward-Venne TA, Witard O, Breen L, Burd NA, Tipton KD, et al.. Protein ingestion to stimulate myofibrillar protein synthesis requires greater relative protein intakes in healthy older versus younger men. J Gerontol A Biol Sci Med Sci. 2015;70(1):57-62.
PMID 25056502 · doi:10.1093/gerona/glu103 - Morton RW, Murphy KT, McKellar SR, Schoenfeld BJ, Henselmans M, Helms E, et al.. A systematic review, meta-analysis and meta-regression of the effect of protein supplementation on resistance training-induced gains in muscle mass and strength in healthy adults. Br J Sports Med. 2018;52(6):376-384.
PMID 28698222 · doi:10.1136/bjsports-2017-097608 · PMC5867436 - Naghshi S, Sadeghi O, Willett WC, Esmaillzadeh A. Dietary intake of total, animal, and plant proteins and risk of all cause, cardiovascular, and cancer mortality: systematic review and dose-response meta-analysis of prospective cohort studies. BMJ. 2020;370:m2412.
PMID 32699048 · doi:10.1136/bmj.m2412 · PMC7374797 - Paddon-Jones D, Sheffield-Moore M, Zhang XJ, Volpi E, Wolf SE, Aarsland A, et al.. Amino acid ingestion improves muscle protein synthesis in the young and elderly. Am J Physiol Endocrinol Metab. 2004;286(3):E321-8.
PMID 14583440 · doi:10.1152/ajpendo.00368.2003 - Pan A, Sun Q, Bernstein AM, Schulze MB, Manson JE, Stampfer MJ, et al.. Red meat consumption and mortality: results from 2 prospective cohort studies. Arch Intern Med. 2012;172(7):555-63.
PMID 22412075 · doi:10.1001/archinternmed.2011.2287 · PMC3712342 - Phillips SM, Chevalier S, Leidy HJ. Protein "requirements" beyond the RDA: implications for optimizing health. Appl Physiol Nutr Metab. 2016;41(5):565-72.
PMID 26960445 · doi:10.1139/apnm-2015-0550 - Poortmans JR, Dellalieux O. Do regular high protein diets have potential health risks on kidney function in athletes?. Int J Sport Nutr Exerc Metab. 2000;10(1):28-38.
PMID 10722779 · doi:10.1123/ijsnem.10.1.28 - Rand WM, Pellett PL, Young VR. Meta-analysis of nitrogen balance studies for estimating protein requirements in healthy adults. Am J Clin Nutr. 2003;77(1):109-27.
PMID 12499330 · doi:10.1093/ajcn/77.1.109 - Raubenheimer D, Simpson SJ. Protein Leverage: Theoretical Foundations and Ten Points of Clarification. Obesity (Silver Spring). 2019;27(8):1225-1238.
PMID 31339001 · doi:10.1002/oby.22531 - Santesso N, Akl EA, Bianchi M, Mente A, Mustafa R, Heels-Ansdell D, et al.. Effects of higher- versus lower-protein diets on health outcomes: a systematic review and meta-analysis. Eur J Clin Nutr. 2012;66(7):780-8.
PMID 22510792 · doi:10.1038/ejcn.2012.37 · PMC3392894 - Saxton RA, Sabatini DM. mTOR Signaling in Growth, Metabolism, and Disease. Cell. 2017;168(6):960-976.
PMID 28283069 · doi:10.1016/j.cell.2017.02.004 · PMC5394987 - Schoenfeld BJ, Aragon AA. How much protein can the body use in a single meal for muscle-building? Implications for daily protein distribution. J Int Soc Sports Nutr. 2018;15:10.
PMID 29497353 · doi:10.1186/s12970-018-0215-1 · PMC5828430 - Seidelmann SB, Claggett B, Cheng S, Henglin M, Shah A, Steffen LM, et al.. Dietary carbohydrate intake and mortality: a prospective cohort study and meta-analysis. Lancet Public Health. 2018;3(9):e419-e428.
PMID 30122560 · doi:10.1016/S2468-2667(18)30135-X · PMC6339822 - Shams-White MM, Chung M, Du M, Fu Z, Insogna KL, Karlsen MC, et al.. Dietary protein and bone health: a systematic review and meta-analysis from the National Osteoporosis Foundation. Am J Clin Nutr. 2017;105(6):1528-1543.
PMID 28404575 · doi:10.3945/ajcn.116.145110 - Simpson SJ, Raubenheimer D. Obesity: the protein leverage hypothesis. Obes Rev. 2005;6(2):133-42.
PMID 15836464 · doi:10.1111/j.1467-789X.2005.00178.x - Skov AR, Toubro S, Rønn B, Holm L, Astrup A. Randomized trial on protein vs carbohydrate in ad libitum fat reduced diet for the treatment of obesity. Int J Obes Relat Metab Disord. 1999;23(5):528-36.
PMID 10375057 · doi:10.1038/sj.ijo.0800867 - Solon-Biet SM, McMahon AC, Ballard JW, Ruohonen K, Wu LE, Cogger VC, et al.. The ratio of macronutrients, not caloric intake, dictates cardiometabolic health, aging, and longevity in ad libitum-fed mice. Cell Metab. 2014;19(3):418-30.
PMID 24606899 · doi:10.1016/j.cmet.2014.02.009 · PMC5087279 - Song M, Fung TT, Hu FB, Willett WC, Longo VD, Chan AT, et al.. Association of Animal and Plant Protein Intake With All-Cause and Cause-Specific Mortality. JAMA Intern Med. 2016;176(10):1453-1463.
PMID 27479196 · doi:10.1001/jamainternmed.2016.4182 · PMC5048552 - Tang JE, Moore DR, Kujbida GW, Tarnopolsky MA, Phillips SM. Ingestion of whey hydrolysate, casein, or soy protein isolate: effects on mixed muscle protein synthesis at rest and following resistance exercise in young men. J Appl Physiol (1985). 2009;107(3):987-92.
PMID 19589961 · doi:10.1152/japplphysiol.00076.2009 - Trommelen J, Holwerda AM, Kouw IW, Langer H, Halson SL, Rollo I, et al.. Resistance Exercise Augments Postprandial Overnight Muscle Protein Synthesis Rates. Med Sci Sports Exerc. 2016;48(12):2517-2525.
PMID 27643743 · doi:10.1249/MSS.0000000000001045 - Trommelen J, Kouw IWK, Holwerda AM, Snijders T, Halson SL, Rollo I, et al.. Presleep dietary protein-derived amino acids are incorporated in myofibrillar protein during postexercise overnight recovery. Am J Physiol Endocrinol Metab. 2018;314(5):E457-E467.
PMID 28536184 · doi:10.1152/ajpendo.00273.2016 - Trumbo P, Schlicker S, Yates AA, Poos M, Food and Nutrition Board of the Institute of Medicine, The National Academies. Dietary reference intakes for energy, carbohydrate, fiber, fat, fatty acids, cholesterol, protein and amino acids. J Am Diet Assoc. 2002;102(11):1621-30.
PMID 12449285 · doi:10.1016/s0002-8223(02)90346-9 - Volpi E, Mittendorfer B, Wolf SE, Wolfe RR. Oral amino acids stimulate muscle protein anabolism in the elderly despite higher first-pass splanchnic extraction. Am J Physiol. 1999;277(3):E513-20.
PMID 10484364 · doi:10.1152/ajpendo.1999.277.3.E513 - Volpi E, Kobayashi H, Sheffield-Moore M, Mittendorfer B, Wolfe RR. Essential amino acids are primarily responsible for the amino acid stimulation of muscle protein anabolism in healthy elderly adults. Am J Clin Nutr. 2003;78(2):250-8.
PMID 12885705 · doi:10.1093/ajcn/78.2.250 · PMC3192452 - Westerterp KR, Wilson SA, Rolland V. Diet induced thermogenesis measured over 24h in a respiration chamber: effect of diet composition. Int J Obes Relat Metab Disord. 1999;23(3):287-92.
PMID 10193874 · doi:10.1038/sj.ijo.0800810 - Westerterp KR. Diet induced thermogenesis. Nutr Metab (Lond). 2004;1(1):5.
PMID 15507147 · doi:10.1186/1743-7075-1-5 · PMC524030 - Westerterp-Plantenga MS, Nieuwenhuizen A, Tomé D, Soenen S, Westerterp KR. Dietary protein, weight loss, and weight maintenance. Annu Rev Nutr. 2009;29:21-41.
PMID 19400750 · doi:10.1146/annurev-nutr-080508-141056 - Wilkinson SB, Tarnopolsky MA, Macdonald MJ, Macdonald JR, Armstrong D, Phillips SM. Consumption of fluid skim milk promotes greater muscle protein accretion after resistance exercise than does consumption of an isonitrogenous and isoenergetic soy-protein beverage. Am J Clin Nutr. 2007;85(4):1031-40.
PMID 17413102 · doi:10.1093/ajcn/85.4.1031 - Witard OC, Jackman SR, Breen L, Smith K, Selby A, Tipton KD. Myofibrillar muscle protein synthesis rates subsequent to a meal in response to increasing doses of whey protein at rest and after resistance exercise. Am J Clin Nutr. 2014;99(1):86-95.
PMID 24257722 · doi:10.3945/ajcn.112.055517 - Wolfe RR. The role of dietary protein in optimizing muscle mass, function and health outcomes in older individuals. Br J Nutr. 2012;108 Suppl 2:S88-93.
PMID 23107552 · doi:10.1017/S0007114512002590 - Wycherley TP, Moran LJ, Clifton PM, Noakes M, Brinkworth GD. Effects of energy-restricted high-protein, low-fat compared with standard-protein, low-fat diets: a meta-analysis of randomized controlled trials. Am J Clin Nutr. 2012;96(6):1281-98.
PMID 23097268 · doi:10.3945/ajcn.112.044321 - Yang Y, Breen L, Burd NA, Hector AJ, Churchward-Venne TA, Josse AR, et al.. Resistance exercise enhances myofibrillar protein synthesis with graded intakes of whey protein in older men. Br J Nutr. 2012;108(10):1780-8.
PMID 22313809 · doi:10.1017/S0007114511007422 - Yang Y, Churchward-Venne TA, Burd NA, Breen L, Tarnopolsky MA, Phillips SM. Myofibrillar protein synthesis following ingestion of soy protein isolate at rest and after resistance exercise in elderly men. Nutr Metab (Lond). 2012;9(1):57.
PMID 22698458 · doi:10.1186/1743-7075-9-57 · PMC3478988 - Zheng Y, Li Y, Satija A, Pan A, Sotos-Prieto M, Rimm E, et al.. Association of changes in red meat consumption with total and cause specific mortality among US women and men: two prospective cohort studies. BMJ. 2019;365:l2110.
PMID 31189526 · doi:10.1136/bmj.l2110 · PMC6559336 - Zhong VW, Van Horn L, Greenland P, Carnethon MR, Ning H, Wilkins JT, et al.. Associations of Processed Meat, Unprocessed Red Meat, Poultry, or Fish Intake With Incident Cardiovascular Disease and All-Cause Mortality. JAMA Intern Med. 2020;180(4):503-512.
PMID 32011623 · doi:10.1001/jamainternmed.2019.6969 · PMC7042891
Continue reading