
Why Peptide Prices Vary
The same research peptide can cost three to seven times more from one seller than another. That dispersion is the market's defining feature — not noise.
Abstract
Across a snapshot of 65 sellers and 23 compounds, the most expensive listing for a given research peptide runs a median of roughly 3.2 times its cheapest, and for the widest-spread compound more than seven times. The dispersion is structural: it comes from how peptides are packaged and priced by the milligram, from a market where manufacturing is not the moat, and from wide differences in how sellers behave. This explainer explains the mechanism and shows why the headline average is the least useful number in the market.
Key findings
- For a typical compound, the dearest listing is about 3.2× the cheapest on a per-milligram basis; the widest-spread compound exceeds 7×, and even the tightest run near 2×. A single 'average price' hides all of this.
- Price is set per milligram, but peptides are sold per vial — so vial size, not the underlying compound, drives much of what a buyer pays, and much of the measured dispersion.
- Manufacturing is not the moat. With low barriers to entry, margin concentrates in vialing, presentation, and brand, and seller pricing discipline varies enormously.
- Price and quality are different axes. A low price is not evidence of poor material, and a high price is not evidence of good material — purity and sterility are established by testing, not by cost.
- The useful signal is structure — dispersion, per-milligram normalization, and a seller's consistency — not the headline number a moving market makes wrong within weeks.
- Methodology
- Analysis of observed public retail listings for research-use-only peptides across 65 sellers and 23 compounds, normalized to price per milligram. Dispersion is the ratio of the highest to the lowest observed per-milligram price for the same compound, across the vial sizes and sellers in the sample. Snapshot, not a live quote.
- Geography
- United States research-use-only market
- Study period
- August 2026 snapshot
Look at the research-use-only peptide market long enough and one fact refuses to go away: the same compound, at the same dose, routinely costs several times more from one seller than another. This is not a rounding error or a stale listing. It is the market's defining feature — and it is the reason a single "average price" is close to useless to anyone actually buying.
In a recent snapshot of sixty-five sellers across twenty-three compounds, the most expensive listing for a given peptide ran a median of about 3.2 times its cheapest, once every price is put on the same per-milligram footing. The spread varies by compound — the tightest run near twofold, and one, thymosin α-1, exceeds sevenfold. Understanding where that gap comes from is the difference between reading the market and being at its mercy.
Why the average is the wrong number
An average price assumes the thing being averaged is roughly uniform. In this market it is not. Prices for one compound do not cluster around a center with a little noise on either side; they fan out across a severalfold range, and the shape of that fan differs from compound to compound.
The figure below shows the point directly. For each compound carried by at least nine sellers it plots the dispersion ratio — the highest observed price per milligram divided by the lowest, for the same compound. A ratio of 5× means the dearest listing costs five times what the cheapest does.
Two things stand out. First, the spread is large across the board: even the tightest compounds here run near twofold, the median sits above threefold, and the widest exceeds sevenfold. Second, more competition does not collapse it — BPC-157, carried by more than thirty sellers, still spreads more than fivefold. Additional sellers have not produced one price; they have produced a wider spray of them.
Where the price actually comes from
Three structural facts explain most of what a buyer experiences.
It is priced by the milligram but sold by the vial
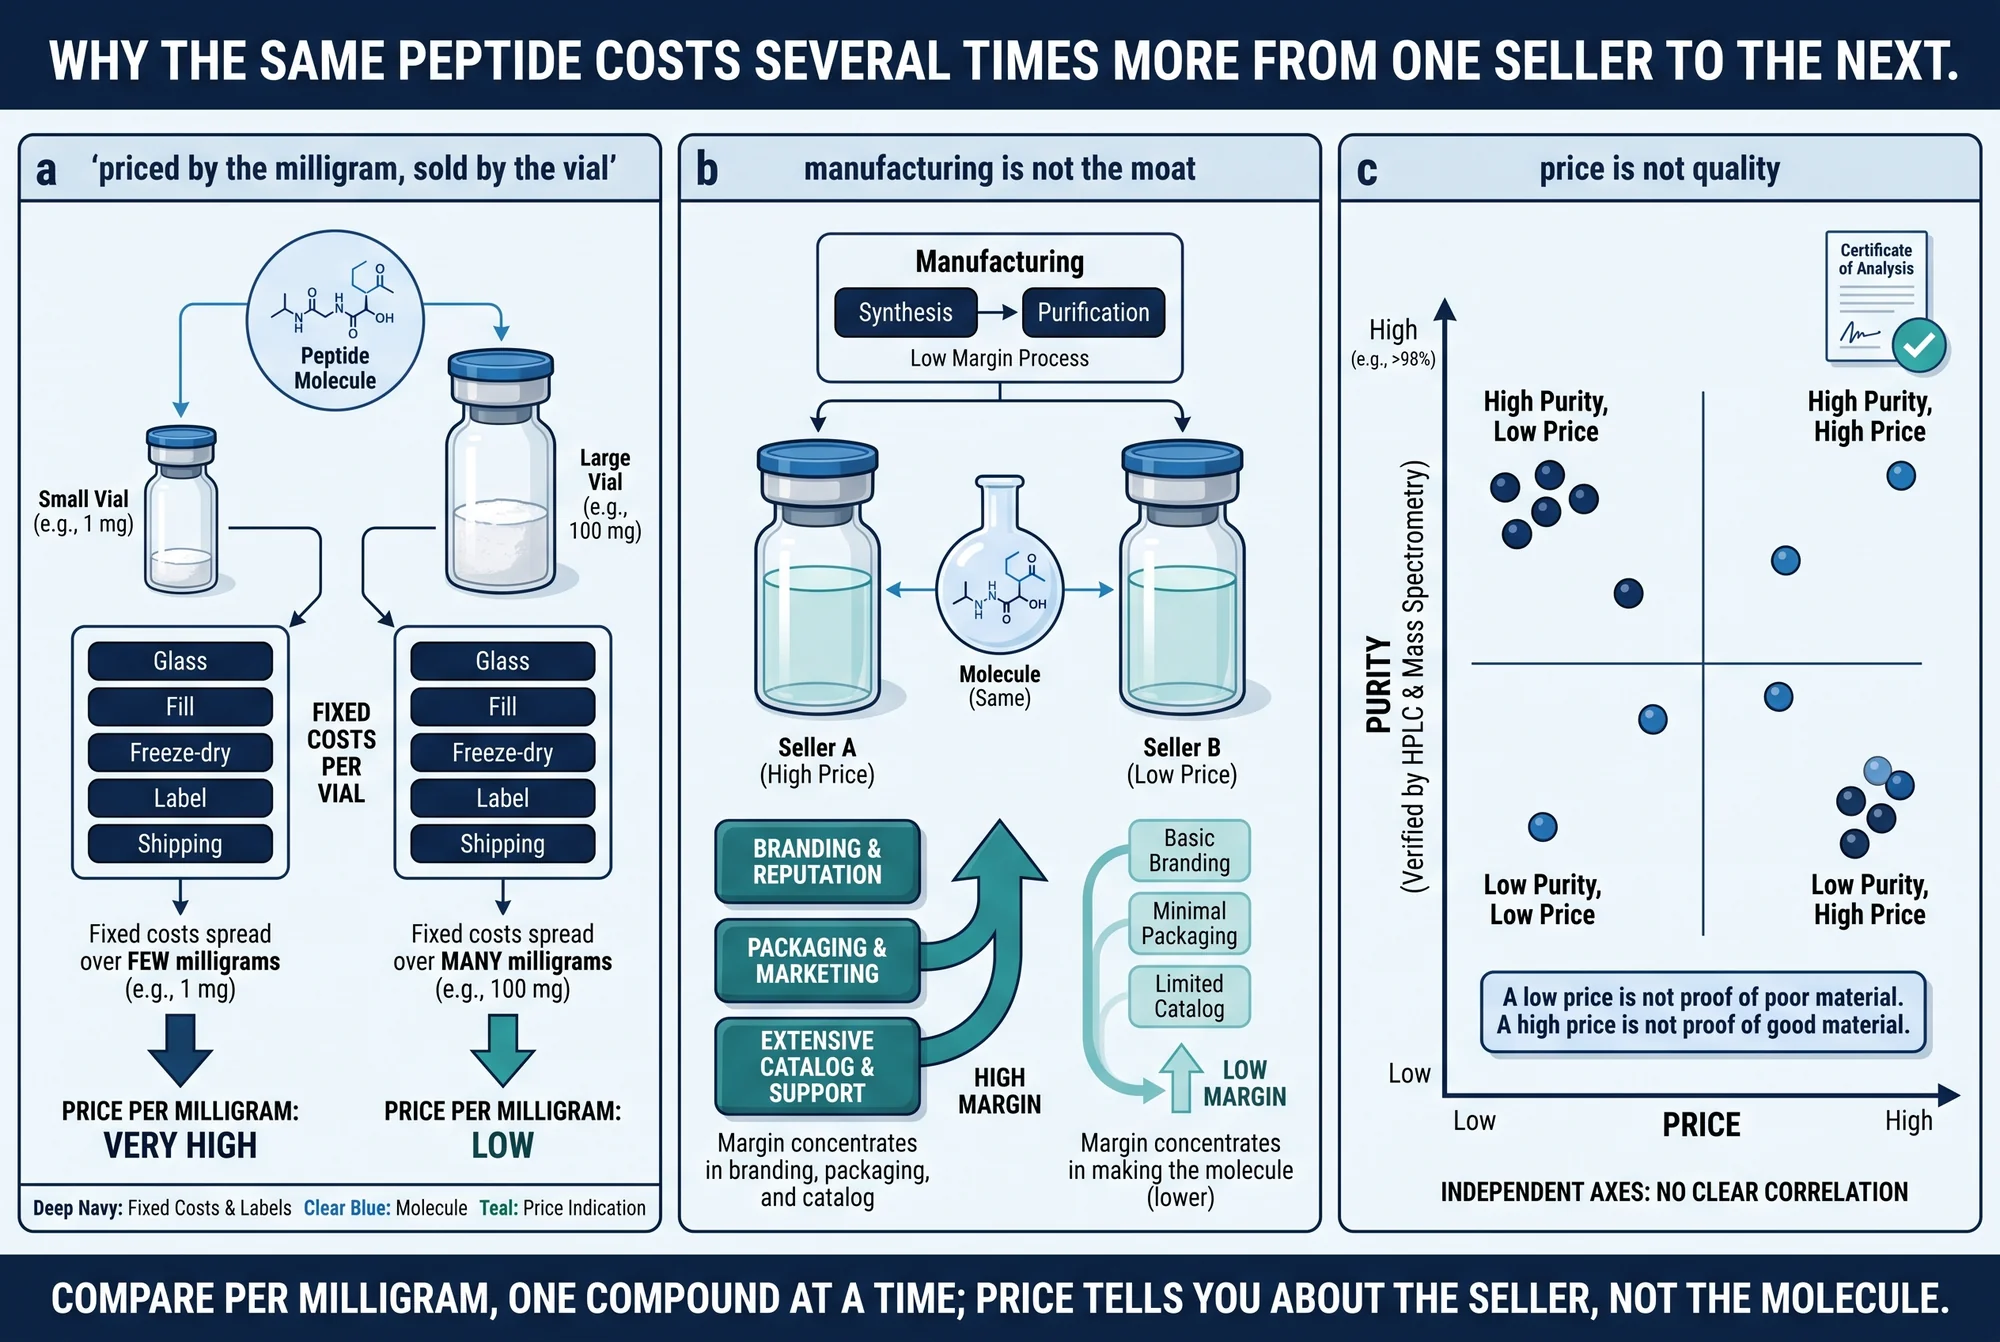
Bulk peptide powder trades per gram. Retail vials are sold as a finished unit — a 5 mg vial, a 10 mg vial, a 50 mg vial — at a unit price. The number that actually matters, price per milligram, is a quotient the listing rarely shows you, and it moves sharply with vial size. The same compound offered in a 5 mg vial and an 80 mg vial can carry per-milligram prices that differ by a multiple, because the fixed costs of a vial — the glass, the fill, the freeze-dry, the label, the shipping, the payment processing — are spread over very different amounts of active material.
This is also why a large part of the dispersion in the figure above is not seller-to-seller haggling at all but vial-size arithmetic: for a compound sold in several sizes, most of its per-milligram range is the size effect. Comparing sticker prices across sellers is therefore meaningless, and the only comparison that survives is per milligram at a comparable size.
Manufacturing is not the moat
In a market with high barriers to entry, price tracks the cost and difficulty of making the product. This is not that market. Synthesis and vialing of common research peptides are widely available, entry is cheap, and the compound itself is rarely the constraint. When manufacturing is not the moat, margin migrates to everything around it — vial presentation, brand, catalog breadth, customer acquisition, and the confidence a seller projects. Two sellers can offer chemically comparable material and price it very differently because they are really selling different packages of trust and convenience, not different molecules.
Seller behavior varies enormously
Because nothing forces prices together, seller conduct becomes a primary driver of what any given buyer pays. Some sellers are disciplined and broadly cheap: in this dataset a handful sit in the lowest third of the market across most of the compounds they carry. Others post a single aggressive price on one popular SKU and price the rest of their catalog unremarkably. Still others are consistently expensive. Across the snapshot, the best price on a compound undercut that compound's category median by an average of roughly a third, and for about one in three of these compound groupings the gap between the best price and the middle of the market exceeded forty per cent. That is not a market rewarding a single "right" price; it is a market in which where you buy is as consequential as what you buy.
How to read the market instead
If the average is the wrong number, what is the right one? Three habits do most of the work.
Normalize to price per milligram. Convert every listing to cost per milligram at a comparable vial size before comparing anything. This one step dissolves most apparent bargains and reveals the genuine ones.
Read a seller's consistency, not a single price. A seller who is reliably in the cheaper third across many compounds is telling you something durable about how they price. A seller who is cheapest on exactly one compound is telling you about that one SKU and nothing more.
Compare within a compound and a category, not across them. Per-milligram prices differ by an order of magnitude across categories for reasons that have nothing to do with any one seller: in this snapshot the GLP-1/weight-management compounds sat near the top of the per-milligram range while high-dose ancillary compounds such as NAD+ sat far below, simply because they are dosed and sold in very different quantities. A GLP-1 compound is not "overpriced" relative to NAD+; they are different goods.
What price does not tell you
The most important caveat is that price and quality are different axes. Nothing in a low price certifies that the material is impure or underfilled, and nothing in a high price certifies that it is pure or correctly dosed. Whether a vial actually contains what the label claims — the right compound, at the stated mass, free of meaningful contamination — is established by analytical testing (identity and purity by methods such as HPLC and mass spectrometry) and by sterility and endotoxin testing, not by the price tag. A certificate of analysis speaks to that question; the price does not. Treating a higher price as a proxy for quality, or a lower one as a red flag, is exactly the inference this market is structured to punish.
What remains uncertain
These figures are a snapshot of a moving market, and they carry real limits. Not every seller is captured for every compound, so a compound's true spread may be wider than the sample shows. Listed prices are not always the transacted price once discounts, minimums, and shipping are included. Coverage is thin for the newest and most restricted compounds — several GLP-1-class products are sold behind account gates or in ways that make like-for-like comparison hard — so the dispersion figures for those should be read as indicative, not precise. And prices change week to week; any specific number here will be wrong soon, which is the whole argument for reading structure rather than a headline figure.
The bottom line
Peptide price dispersion is not a defect in the market to be averaged away. It is the predictable output of pricing by the milligram, selling by the vial, competing in a business where manufacturing is not the moat, and letting sellers set prices with little to pull them together. The buyer who understands that stops asking "what does this cost?" and starts asking "what does this cost per milligram, from a seller who prices this way consistently, for a compound I am comparing only against its peers?" That is the question the market's structure can actually answer.
This analysis draws on South Beach Longevity's research-use-only peptide market dataset — observed public retail listings across sixty-five sellers and twenty-three compounds, captured in an August 2026 snapshot and normalized to price per milligram. It describes a research-chemical market, not medicines, and is offered as market analysis, not a price quote or a recommendation to purchase or use any compound. For a shorter treatment of the same idea, see Why the same peptide can cost several times more from one seller than another.
Disclosures
Market analysis only. Figures describe observed retail listings for research-use-only products and are not endorsements, price quotes, or recommendations to purchase or use any compound. Contains no confidential cost or margin data.