
What Is Metabolic Health?
It is not a single number, and it is rarer than most people think — a cluster of measures that describe how well your body handles fuel.
Abstract
Metabolic health describes how well the body manages energy, and it is measured as a cluster of related signals — glucose and insulin regulation, blood lipids, blood pressure, and fat distribution — rather than any single value. By stricter recent criteria, only about one in fifteen US adults is in optimal cardiometabolic health. This review explains the components, the central role of insulin resistance, how the state is measured, why it predicts cardiovascular disease and diabetes, and which interventions have been shown to move it.
Key findings
- Metabolic health is a cluster, not a number: glucose, insulin sensitivity, blood lipids, blood pressure, and fat distribution. Metabolic syndrome is any three of five abnormal components (Alberti et al., 2009).
- It is uncommon. Only 12.2% of US adults met a strict definition of optimal metabolic health (Araújo et al., 2019); a joint cardiometabolic definition put it at 6.8% (O'Hearn et al., 2022).
- Insulin resistance sits upstream. Skeletal-muscle insulin resistance is detectable decades before blood sugar rises and is the initiating defect in type 2 diabetes (DeFronzo & Tripathy, 2009).
- It predicts hard outcomes: metabolic syndrome roughly doubles cardiovascular risk (RR 2.35; Mottillo et al., 2010) and multiplies diabetes risk several-fold (Ford et al., 2008).
- It is modifiable. Lifestyle change cut diabetes incidence 58% (Knowler et al., 2002); intensive weight loss produced diabetes remission in 46% vs 4% of controls, dose-dependent on weight lost (Lean et al., 2018).
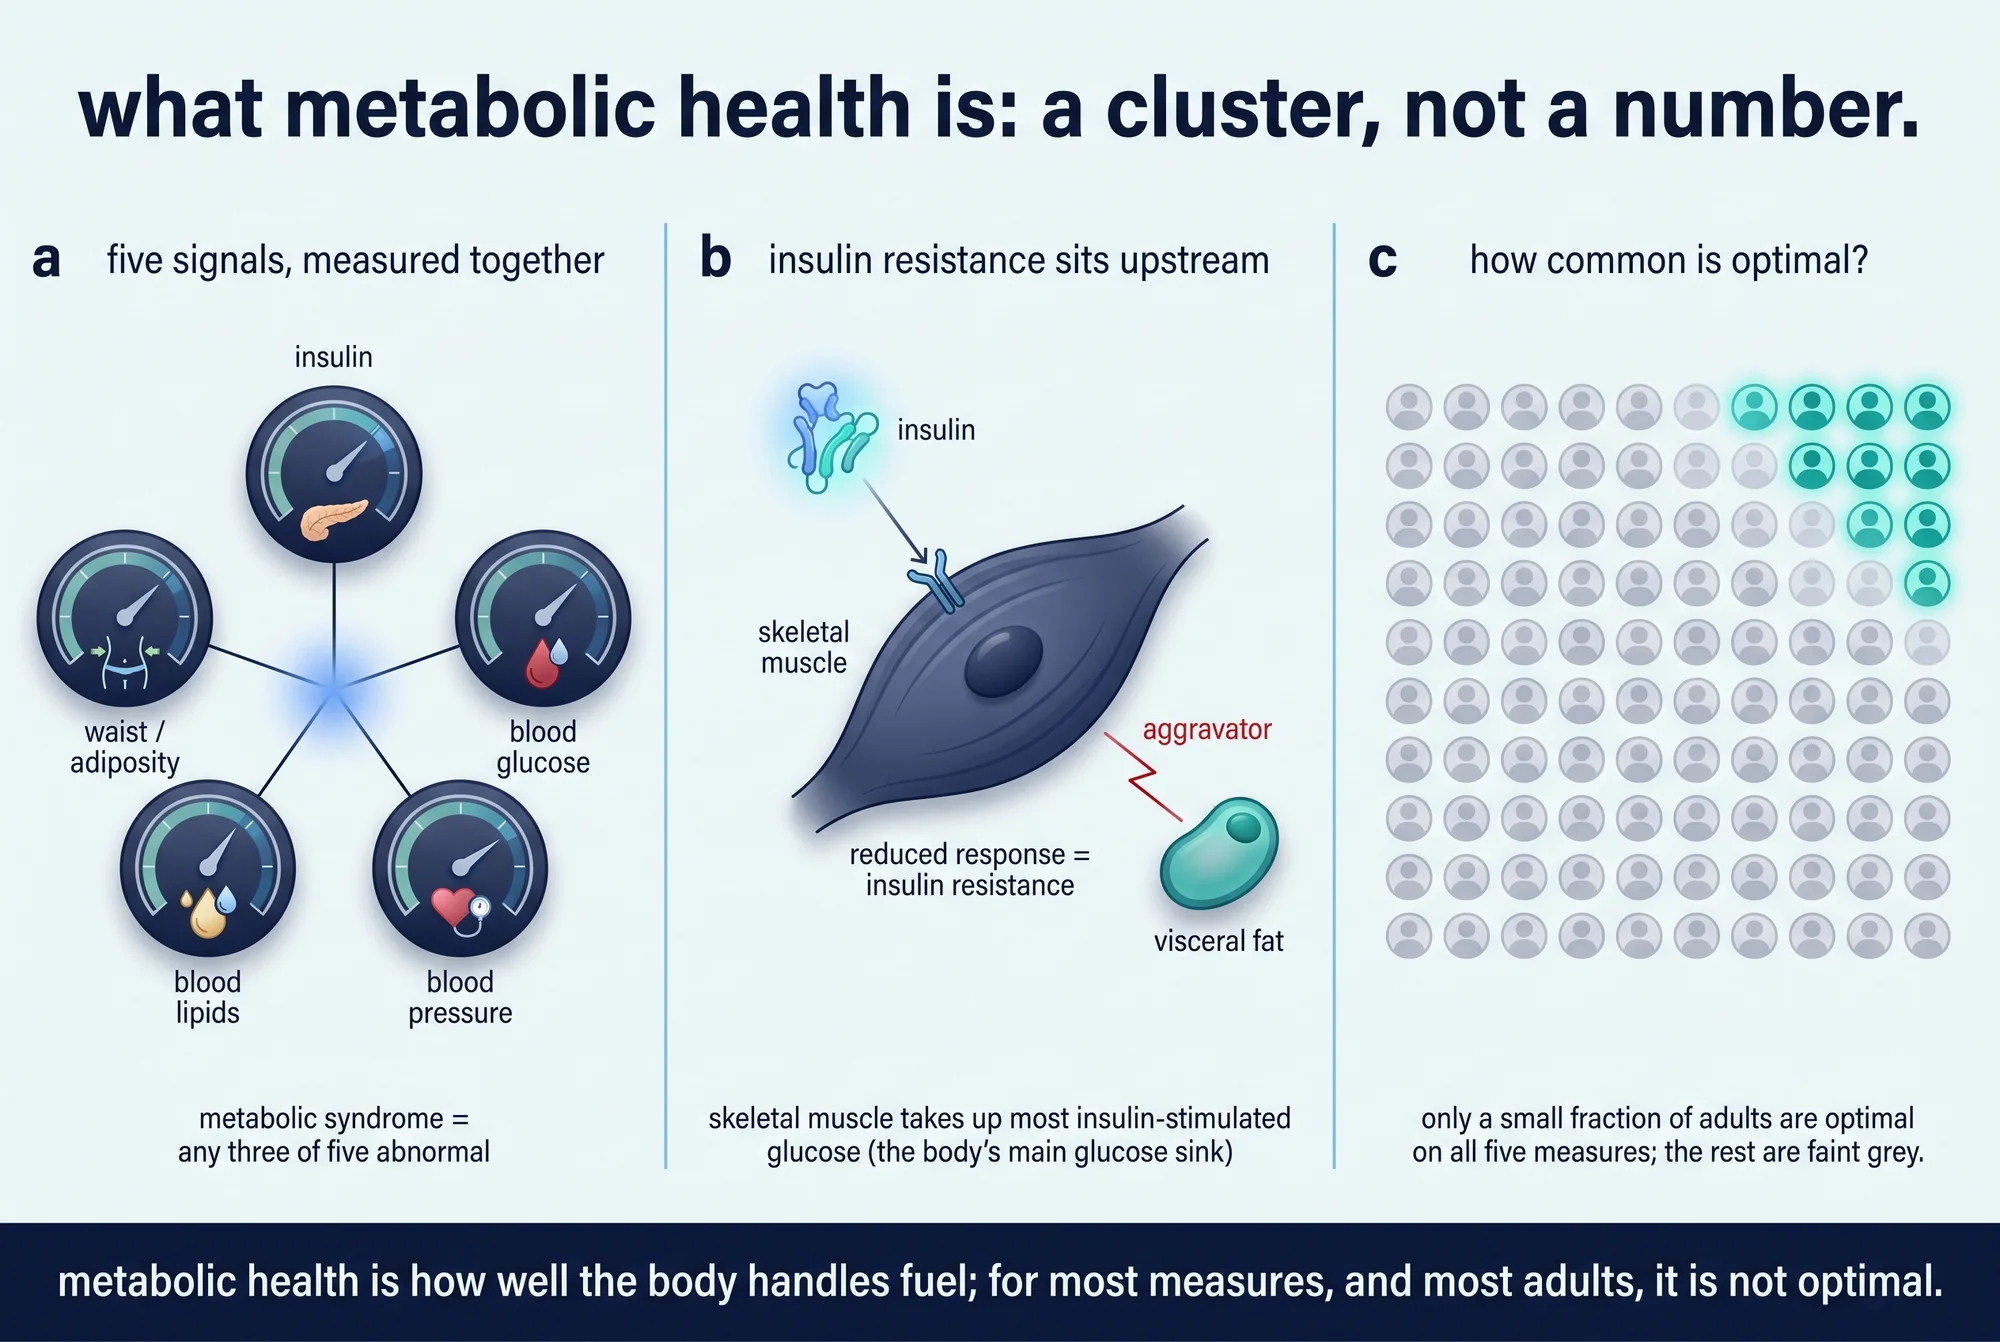
Ask what "metabolic health" means and most answers reach for a single thing — a blood-sugar reading, a number on a scale. That instinct is the first thing to correct. Metabolic health is not one measurement. It is a cluster of related signals that together describe one underlying question: how well does your body take in energy, store it, and use it without the system straining? When those signals — blood glucose, the insulin needed to control it, blood fats, blood pressure, and where the body keeps its fat — all sit in a good range at once, a person is metabolically healthy. When several drift together, they tend to drift for the same underlying reason.
The second thing to correct is how common the good state is. By recent, stricter criteria only about one in eight US adults meets a definition of optimal metabolic health, and by a joint cardiometabolic definition the figure is closer to one in fifteen (Araújo et al., 2019; O'Hearn et al., 2022). Metabolic health is not the default that illness departs from. For most adults it is the exception.
A cluster, not a number
The clinical shorthand for the unhealthy end of this spectrum is metabolic syndrome, and its definition makes the cluster idea explicit. An international harmonized statement defines it by five components — raised waist circumference, raised triglycerides, low HDL ("good") cholesterol, raised blood pressure, and raised fasting glucose — and a person qualifies when any three of the five are abnormal (Alberti et al., 2009). No single component is required. That design is the point: the syndrome is a pattern of co-occurring problems, not a single failing part.
How many people have the opposite — all the signals in an optimal range? Fewer than intuition suggests, and the exact figure depends on how strictly you draw the lines. Using recent cut points, one NHANES analysis found only 12.2% of US adults in optimal metabolic health; loosening the criteria to older thresholds raised that to about 20% (Araújo et al., 2019). A separate analysis using a stricter joint definition of optimal cardiometabolic health — good adiposity, glucose, lipids, and blood pressure together, with no established cardiovascular disease — put the figure at just 6.8% in 2017–2018 (O'Hearn et al., 2022). The two numbers are not in conflict; they use different components and years. They tell the same story from two angles: each individual measure is optimal in only a minority of adults, and all of them at once in a small sliver.
Insulin, and the resistance that comes first
Underneath the cluster sits one hormone. After a meal, the pancreas releases insulin, which acts as a signal telling cells — especially muscle, liver, and fat — to pull glucose out of the bloodstream and store it. When that signal works, blood glucose rises briefly after eating and settles back down. The central failure in poor metabolic health is that cells stop responding to the signal as readily. That reduced response is called insulin resistance (DeFronzo & Tripathy, 2009).
Two features of insulin resistance explain why it is upstream of almost everything else in the cluster. First, it appears early. Skeletal-muscle insulin resistance is detectable decades before blood sugar itself rises, and long-running studies show it is the initiating defect on the road to type 2 diabetes: overt high blood sugar emerges only once the pancreas can no longer compensate by making ever-more insulin (DeFronzo & Tripathy, 2009). Second, the compensation is self-defeating. To keep glucose normal, the resistant body runs chronically high insulin — and, in controlled human experiments, sustained high insulin itself further blunts the muscle's response over a few days, a self-reinforcing loop (DeFronzo & Tripathy, 2009).
Because insulin resistance is hard to measure directly outside a research lab, clinicians estimate it. The most common surrogate, HOMA-IR, is calculated from a single pair of fasting glucose and fasting insulin values and was validated against the gold-standard clamp technique (Matthews et al., 1985). It is a useful screen, but an approximate one — it reflects mostly hepatic insulin sensitivity and carries meaningful measurement variability, so it is a signpost rather than a verdict.
How metabolic health is measured
Because the cluster has several parts, no single test captures it. The glucose axis alone is read three different ways, each capturing a different window:
- Fasting glucose is governed mainly by the liver's overnight output of sugar.
- Post-meal (or oral glucose tolerance) testing reflects mostly how quickly muscle clears a sugar load.
- A1C (HbA1c) reflects average blood glucose over roughly the prior two to three months; the relationship is close enough to be expressed as a formula (estimated average glucose = 28.7 × A1C − 46.7) that holds across age, sex, and diabetes type (Nathan et al., 2008).
The diagnostic thresholds are set by the American Diabetes Association: diabetes at A1C ≥ 6.5%, fasting glucose ≥ 126 mg/dL, or a two-hour tolerance value ≥ 200 mg/dL, with the intermediate "prediabetes" ranges just below each (American Diabetes Association, 2024). These are the lines that turn a continuous measure into a label.
A newer tool, continuous glucose monitoring (CGM), adds the dynamics that single time-points miss. Used in people without diabetes, CGM has revealed that individuals who look normoglycemic on standard tests still spend meaningful time in higher glucose ranges and fall into distinct "glucotypes" (Hall et al., 2018). That is a genuine observation about variability — but it is worth stating plainly what it does not yet show: there is no strong outcome evidence that acting on CGM data improves health in people who do not have diabetes. It is informative; its benefit in the healthy is unproven.
Where the fat sits matters more than how much
Body fat is not metabolically uniform, and the cluster tracks its location. Fat packed around the abdominal organs — visceral fat — is far more strongly tied to metabolic risk than the subcutaneous fat under the skin. In the Framingham Heart Study, with fat compartments measured directly by CT, a standard increase in visceral fat carried an odds ratio for metabolic syndrome of about 4.7 in women, versus 3.0 for the same increase in subcutaneous fat, and the visceral association persisted even after accounting for overall weight and waist size (Fox et al., 2007). A subsequent international position statement concluded that visceral and ectopic fat — fat deposited in organs that should not store much, such as the liver — are independent markers of cardiovascular and metabolic risk (Neeland et al., 2019).
Fat in the liver has since been folded formally into the metabolic picture. In 2023 a multisociety consensus renamed the common form of fatty liver MASLD — metabolic dysfunction-associated steatotic liver disease — and, notably, made the presence of a cardiometabolic risk factor part of the diagnosis (Rinella et al., 2023). The rename encodes a scientific judgment: for most people, a fatty liver is not a separate problem but the liver's expression of the same metabolic cluster. This is why a tape measure at the waistline remains a useful bedside proxy — it is a cheap read on the fat depot that matters most (Alberti et al., 2009).
Muscle is a metabolic organ, not just an engine
If visceral fat is the cluster's aggravator, skeletal muscle is its great stabilizer — and this is the part most people underrate. Under controlled conditions, 80–90% of the glucose the body disposes of in response to insulin is taken up by skeletal muscle (DeFronzo & Tripathy, 2009). Muscle is, quite literally, the body's largest glucose sink. That is also why muscle insulin resistance is so consequential: because muscle handles most of the load, the earliest detectable defect in the path to type 2 diabetes is impaired glucose uptake into muscle (DeFronzo & Tripathy, 2009).
Muscle is not only a sink but a signaling organ. Contracting muscle releases myokines — the archetype, interleukin-6, can rise as much as a hundredfold in the blood during exercise — through which muscle communicates with fat, liver, and immune tissue (Pedersen & Febbraio, 2008). The mechanistic detail matters less than the reframing: maintaining muscle is not only about strength but about preserving the tissue that does most of the body's metabolic work.
Why it matters: what poor metabolic health predicts
The cluster is not merely descriptive; it forecasts disease. A meta-analysis of 87 studies and nearly a million people found that metabolic syndrome was associated with roughly a doubling of cardiovascular risk (relative risk 2.35) and a 58% higher risk of death from any cause — and, importantly, the elevated cardiovascular risk persisted in people who did not have diabetes (Mottillo et al., 2010). The link to diabetes itself is stronger still: across sixteen cohorts, metabolic syndrome multiplied the risk of developing type 2 diabetes roughly three- to fivefold (relative risk 3.5–5.2 depending on the definition), and those with four or more abnormal components carried far higher risk again (Ford et al., 2008).
A useful caution travels with these numbers. The same analyses note that a single component — fasting glucose — may predict diabetes about as well as the full syndrome (Ford et al., 2008), and that it is not settled whether the syndrome as a composite adds predictive power beyond the sum of its parts (Mottillo et al., 2010). The cluster is a powerful organizing idea and a strong risk signal; it is not proven to be greater than its components.
Is "metabolically healthy obesity" benign?
One of the most-debated questions in the field is whether a person can carry excess weight and still be metabolically healthy in a way that is genuinely low-risk. The honest answer from the evidence is usually not, and often not for long. A meta-analysis found that metabolically healthy obese individuals still had elevated risk of death and cardiovascular events compared with metabolically healthy normal-weight people once studies with a decade or more of follow-up were considered, prompting the authors' conclusion that "there is no healthy pattern of increased weight" (Kramer et al., 2013). A cohort of 3.5 million adults found metabolically healthy obesity still carried higher risk of coronary heart disease and heart failure than metabolic health at normal weight (Caleyachetty et al., 2017). And a 30-year study of more than 90,000 women found that 84% of those with metabolically healthy obesity converted to an unhealthy phenotype within 20 years — the "healthy" state was often a way station, not a destination (Eckel et al., 2018).
The residual debate is about magnitude and whether a small, genuinely stable low-risk subgroup exists. What the three independent designs agree on is the direction: metabolically healthy obesity carries more risk than metabolic health at normal weight, and it tends not to persist.
What actually moves it
The most important fact about metabolic health is that it is not fixed. The interventional evidence — the kind that can support cause-and-effect language, for exactly what it tested — is unusually strong:
- Lifestyle change prevents diabetes. In the Diabetes Prevention Program, a randomized trial in adults with elevated glucose, a program targeting modest weight loss and about 150 minutes of weekly activity reduced new diabetes by 58% over roughly three years — outperforming the drug metformin (Knowler et al., 2002).
- Exercise improves insulin sensitivity directly. Pooling randomized trials that measured glucose disposal with the clamp technique, exercise training produced a clear improvement in insulin-stimulated glucose uptake, greatest when accompanied by weight loss (Rebello et al., 2023).
- Weight loss can reverse early type 2 diabetes. In the DiRECT trial, an intensive weight-management program achieved diabetes remission in 46% of participants versus 4% of controls at one year, and remission tracked the amount of weight lost — from essentially none in those who gained weight to 86% in those who lost 15 kg or more (Lean et al., 2018). The core defect, at least early, is modifiable.
- Supporting evidence points the same way for sleep (short sleep measurably worsened insulin sensitivity in a small controlled crossover; Nedeltcheva et al., 2009) and dietary pattern (a Mediterranean diet reduced cardiovascular events in a large randomized trial — though its endpoint was heart attacks and strokes rather than the metabolic markers themselves, and the figures come from the trial's 2018 republication after the original was re-analyzed for enrollment irregularities; Estruch et al., 2018).
These are reported as what the studies observed, in the populations they enrolled — not as a prescription. But the collective message is clear and hopeful: metabolic health responds to how a body is fed, moved, and rested.
What remains uncertain
Several honest caveats belong beside the confidence:
- The labels depend on the ruler. The prevalence of "metabolic health" swings from 12% to 20% purely by changing cut points (Araújo et al., 2019), and the harmonized definition deliberately leaves waist thresholds to be set population by population (Alberti et al., 2009). The categories are useful conventions, not natural boundaries.
- Composite versus parts is unresolved: it is not proven that the syndrome predicts more than its individual components (Ford et al., 2008; Mottillo et al., 2010).
- CGM in people without diabetes documents real variability but has not been shown to improve outcomes when acted upon (Hall et al., 2018).
- Most outcome evidence is observational. The cohort and cross-sectional studies establish strong association; the causal claims rest on the randomized trials (the Diabetes Prevention Program, DiRECT, the exercise trials), and only for what those trials actually changed.
The common misunderstanding
The single most common error is to equate metabolic health with being thin. It is not the same axis. A person can be lean and metabolically unhealthy, and a person can carry excess weight with — for a time — a relatively favorable profile. Body weight is one input to the cluster, and an important one, but the cluster is defined by how the body handles fuel, not by the number on a scale. Reading metabolic health off appearance is exactly the shortcut the evidence warns against.
This review summarizes published human evidence through 2024 on the definition, measurement, consequences, and modifiability of metabolic health. It is educational and is not medical advice, a diagnosis, or a treatment plan; the study parameters cited are reported with the population and design that produced them. For the related therapeutics, see What Is GLP-1 and How Does It Work?, and browse the Metabolic health hub.
References
- 1.Alberti KGMM, Eckel RH, Grundy SM, et al. Harmonizing the metabolic syndrome: a joint interim statement. Circulation. 2009;120(16):1640-1645. doi:10.1161/CIRCULATIONAHA.109.192644
- 2.Araújo J, Cai J, Stevens J. Prevalence of optimal metabolic health in American adults: NHANES 2009-2016. Metab Syndr Relat Disord. 2019;17(1):46-52. doi:10.1089/met.2018.0105
- 3.O'Hearn M, Lauren BN, Wong JB, Kim DD, Mozaffarian D. Trends and disparities in cardiometabolic health among U.S. adults, 1999-2018. J Am Coll Cardiol. 2022;80(2):138-151. doi:10.1016/j.jacc.2022.04.046
- 4.DeFronzo RA, Tripathy D. Skeletal muscle insulin resistance is the primary defect in type 2 diabetes. Diabetes Care. 2009;32(Suppl 2):S157-S163. doi:10.2337/dc09-S302
- 5.Matthews DR, Hosker JP, Rudenski AS, et al. Homeostasis model assessment (HOMA). Diabetologia. 1985;28(7):412-419. doi:10.1007/BF00280883
- 6.Nathan DM, Kuenen J, Borg R, et al. Translating the A1C assay into estimated average glucose values. Diabetes Care. 2008;31(8):1473-1478. doi:10.2337/dc08-0545
- 7.Hall H, Perelman D, Breschi A, et al. Glucotypes reveal new patterns of glucose dysregulation. PLoS Biol. 2018;16(7):e2005143. doi:10.1371/journal.pbio.2005143
- 8.Fox CS, Massaro JM, Hoffmann U, et al. Abdominal visceral and subcutaneous adipose tissue compartments (Framingham Heart Study). Circulation. 2007;116(1):39-48. doi:10.1161/CIRCULATIONAHA.106.675355
- 9.Neeland IJ, Ross R, Després JP, et al. Visceral and ectopic fat, atherosclerosis, and cardiometabolic disease: a position statement. Lancet Diabetes Endocrinol. 2019;7(9):715-725. doi:10.1016/S2213-8587(19)30084-1
- 10.Rinella ME, Lazarus JV, Ratziu V, et al. A multisociety Delphi consensus statement on new fatty liver disease nomenclature. Hepatology. 2023;78(6):1966-1986. doi:10.1097/HEP.0000000000000520
- 11.Pedersen BK, Febbraio MA. Muscle as an endocrine organ: focus on muscle-derived interleukin-6. Physiol Rev. 2008;88(4):1379-1406. doi:10.1152/physrev.90100.2007
- 12.Mottillo S, Filion KB, Genest J, et al. The metabolic syndrome and cardiovascular risk: a systematic review and meta-analysis. J Am Coll Cardiol. 2010;56(14):1113-1132. doi:10.1016/j.jacc.2010.05.034
- 13.Ford ES, Li C, Sattar N. Metabolic syndrome and incident diabetes: current state of the evidence. Diabetes Care. 2008;31(9):1898-1904. doi:10.2337/dc08-0423
- 14.Kramer CK, Zinman B, Retnakaran R. Are metabolically healthy overweight and obesity benign conditions? Ann Intern Med. 2013;159(11):758-769. doi:10.7326/0003-4819-159-11-201312030-00008
- 15.Caleyachetty R, Thomas GN, Toulis KA, et al. Metabolically healthy obese and incident cardiovascular disease events among 3.5 million men and women. J Am Coll Cardiol. 2017;70(12):1429-1437. doi:10.1016/j.jacc.2017.07.763
- 16.Eckel N, Li Y, Kuxhaus O, et al. Transition from metabolic healthy to unhealthy phenotypes (Nurses' Health Study, 30-year follow-up). Lancet Diabetes Endocrinol. 2018;6(9):714-724. doi:10.1016/S2213-8587(18)30137-2
- 17.Knowler WC, Barrett-Connor E, Fowler SE, et al. Reduction in the incidence of type 2 diabetes with lifestyle intervention or metformin. N Engl J Med. 2002;346(6):393-403. doi:10.1056/NEJMoa012512
- 18.Rebello CJ, Zhang D, Kirwan JP, et al. Effect of exercise training on insulin-stimulated glucose disposal: a meta-analysis of RCTs. Int J Obes (Lond). 2023;47(5):348-357. doi:10.1038/s41366-023-01283-8
- 19.Lean MEJ, Leslie WS, Barnes AC, et al. Primary care-led weight management for remission of type 2 diabetes (DiRECT). Lancet. 2018;391(10120):541-551. doi:10.1016/S0140-6736(17)33102-1
- 20.Nedeltcheva AV, Kessler L, Imperial J, Penev PD. Recurrent sleep restriction, insulin resistance, and glucose tolerance. J Clin Endocrinol Metab. 2009;94(9):3242-3250. doi:10.1210/jc.2009-0483
- 21.Estruch R, Ros E, Salas-Salvadó J, et al. Primary prevention of cardiovascular disease with a Mediterranean diet (PREDIMED, republished). N Engl J Med. 2018;378(25):e34. doi:10.1056/NEJMoa1800389
- 22.American Diabetes Association. Diagnosis and classification of diabetes: Standards of Care in Diabetes—2024. Diabetes Care. 2024;47(Suppl 1):S20-S42. doi:10.2337/dc24-S002
Disclosures
Educational review of published evidence. Not medical advice, diagnosis, or a treatment recommendation. Study parameters are reported with the population and design that produced them.