
What Is Insulin Resistance?
The quiet, early state that comes before high blood sugar — when muscle, liver, and fat stop responding to insulin, and the body compensates by making more.
Abstract
Insulin resistance is a reduced response of the body's tissues — chiefly skeletal muscle, the liver, and fat — to a given amount of insulin. Because the pancreas compensates by secreting more insulin, a person can be substantially insulin-resistant for years while fasting glucose and HbA1c still read normal, which is why the state sits upstream of, and earlier than, high blood sugar. This review explains what insulin resistance is, the ectopic-lipid mechanism that produces it, how it is measured (from the gold-standard clamp to the HOMA-IR surrogate and its limits), why skeletal muscle is central, what it predicts, and which interventions have been shown to improve it. Throughout, it keeps a plausible mechanism separate from a demonstrated human outcome, and distinguishes effect sizes measured on a resistance index from those measured on the broader metabolic-syndrome cluster.
Key findings
- Insulin resistance is a reduced response of muscle, liver, and fat to insulin. The body compensates by making more insulin, so fasting glucose and HbA1c can look normal for years while the resistance is well established (DeFronzo & Tripathy, 2009; Reaven, 1988).
- It is upstream and early. Skeletal-muscle insulin resistance is the initiating defect in type 2 diabetes and can be present one to two decades before blood sugar rises, though the steep, easily measured decline clusters in the final ~5 years (DeFronzo & Tripathy, 2009; Warram et al., 1990; Tabák et al., 2009).
- The mechanism is fat in the wrong place. Lipid metabolites inside muscle and liver cells blunt the insulin signal; young, lean, insulin-resistant people already show ~80% more fat inside the muscle cell and ~60% lower insulin-stimulated glucose uptake (Petersen et al., 2004; Samuel & Shulman, 2012).
- As a resistance index, higher HOMA-IR carries higher coronary risk in people without diabetes (RR 1.64) and outperforms fasting glucose or insulin (Gast et al., 2012) — a measure distinct from the metabolic-syndrome cluster, which roughly doubles cardiovascular risk (Mottillo et al., 2010).
- It is modifiable. Exercise raised clamp-measured glucose disposal (Rebello et al., 2023); lifestyle change cut diabetes incidence 58% (Knowler et al., 2002); and intensive weight loss produced diabetes remission in 46% versus 4% of controls, dose-dependent on weight lost (Lean et al., 2018).
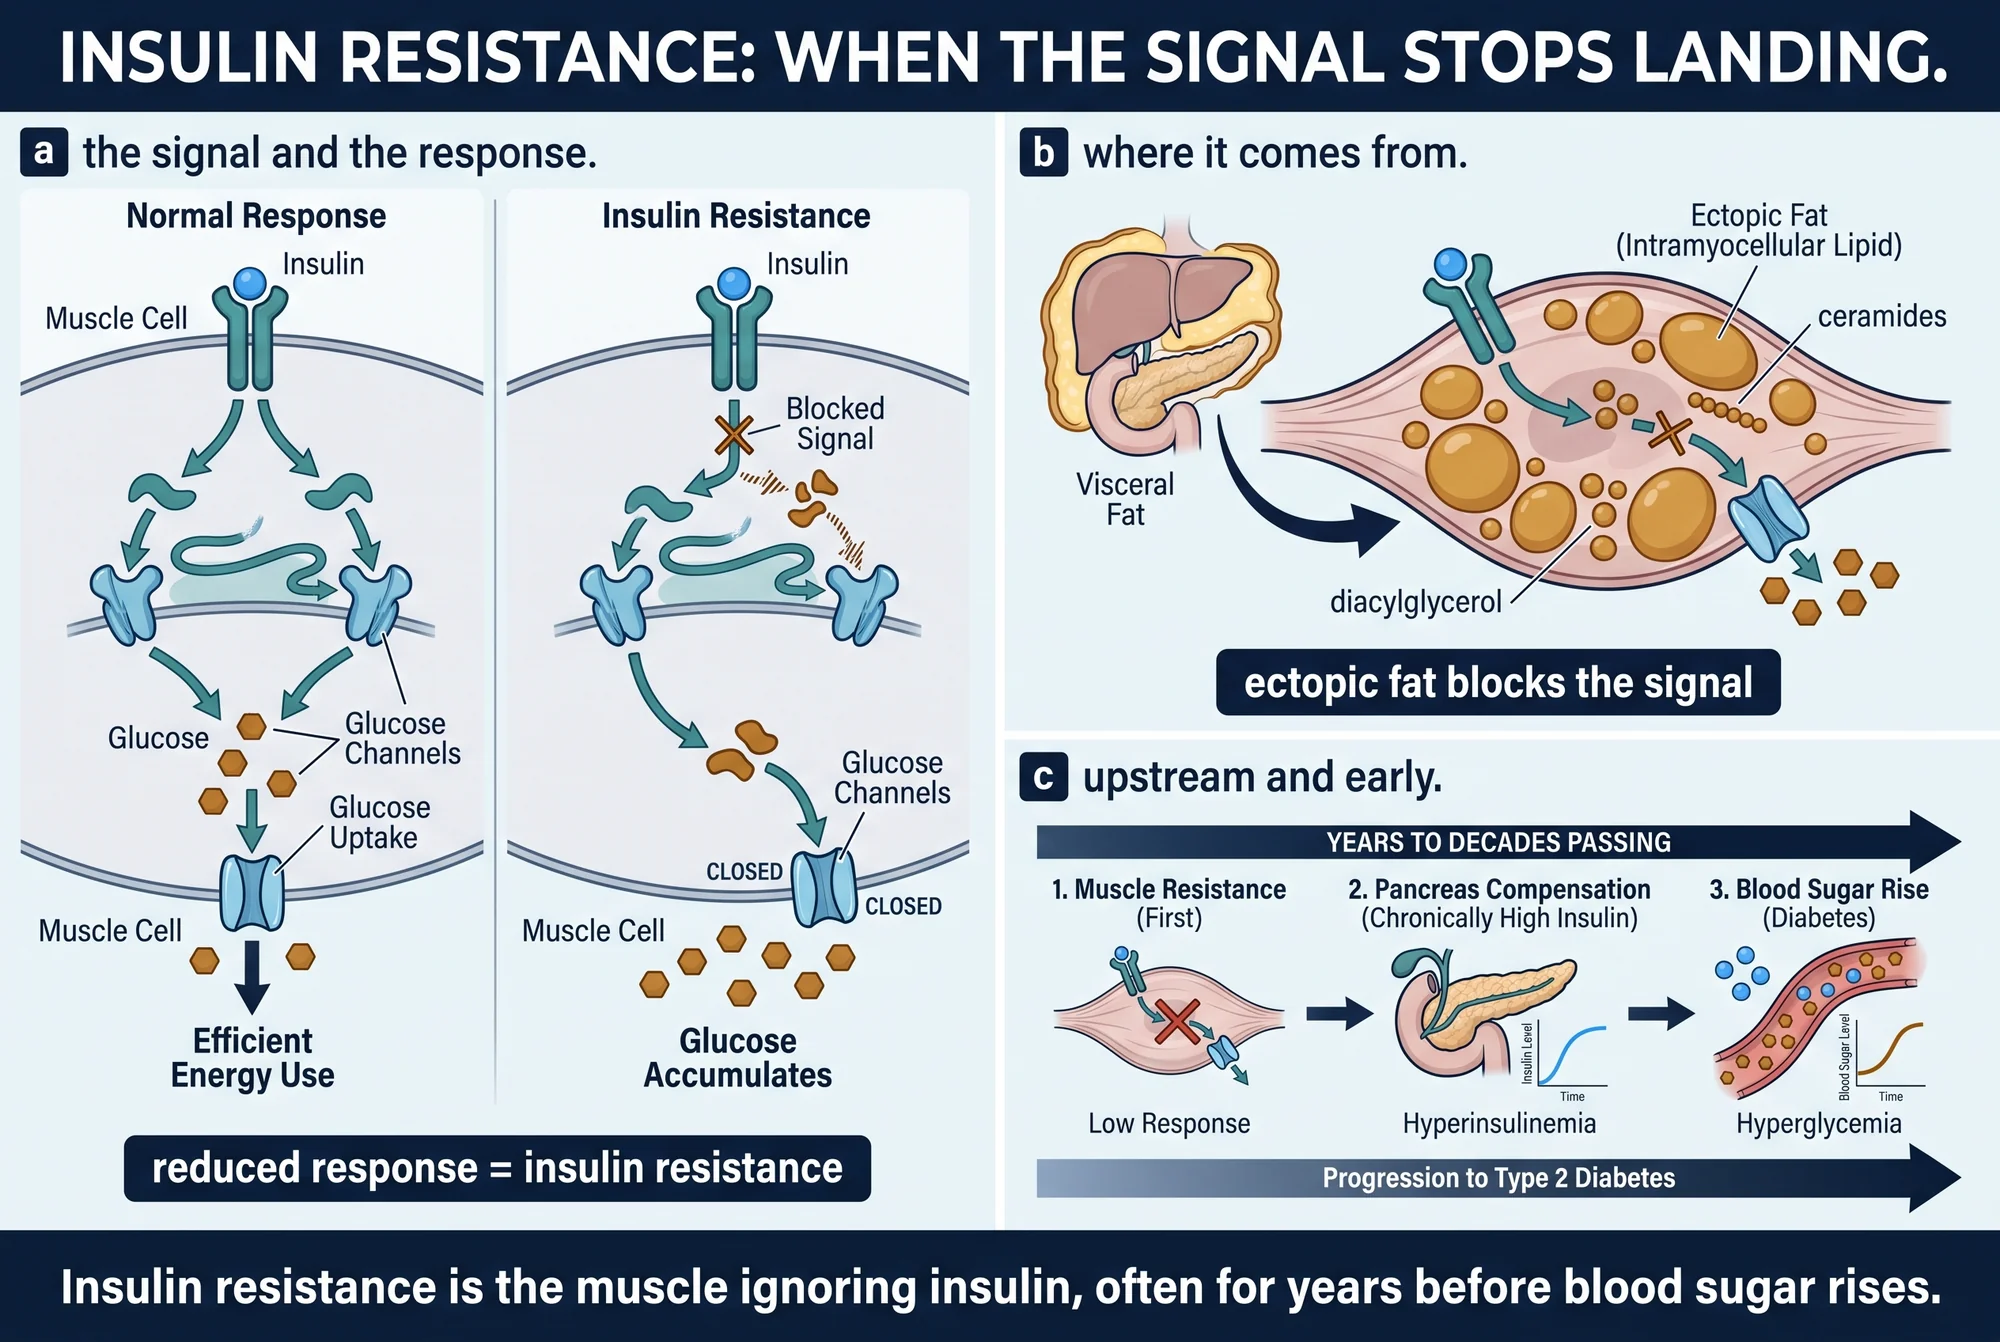
Insulin resistance is a change in how the body handles fuel that can advance for years without producing a single symptom. After a meal, the pancreas releases insulin, a hormone that works as a signal: it tells cells — above all in skeletal muscle, the liver, and fat — to pull glucose out of the blood and store it. Insulin resistance is what the name says: those tissues respond less to a given amount of that signal, so more insulin is needed for the same job (DeFronzo & Tripathy, 2009). It is defined by a diminished response, not by anything a person can feel.
That definition explains why insulin resistance is so easy to miss. The body's first reaction to a weakening signal is to send it more loudly: the pancreas secretes extra insulin, and for a long time that keeps blood glucose normal. A person can be substantially insulin-resistant while fasting glucose and HbA1c still read normal, because the compensation is holding (Reaven, 1988). High blood sugar is not the start of the problem; it surfaces late, once the pancreas can no longer keep pace. Insulin resistance is the quieter state that comes first.
What insulin resistance actually is
Formally, insulin resistance is a reduced response of insulin's target tissues — skeletal muscle, the liver, and fat — measured against people who have normal glucose tolerance and no family history of diabetes (DeFronzo & Tripathy, 2009). It is a functional description: the same amount of insulin moves less glucose than it should.
The idea that one defect could sit behind a whole family of disorders is not new. In his 1988 Banting Lecture, Gerald Reaven proposed that resistance to insulin-stimulated glucose uptake clustered with high blood pressure, high triglycerides, and low HDL cholesterol — a grouping he called "Syndrome X," the seed of what is now called metabolic syndrome (Reaven, 1988). Reaven also noted that the state is common and hidden: resistance was present not only in most people with impaired glucose tolerance or type 2 diabetes but in roughly a quarter of non-obese people with normal glucose tolerance. Those people looked normal because of compensation — glucose tolerance holds only for as long as the pancreatic beta-cell can sustain the higher insulin output the resistance demands.
How insulin resistance develops: fat in the wrong place
To see where insulin resistance begins, follow the glucose. Skeletal muscle is the body's largest disposal site for the glucose in a meal: under controlled laboratory conditions, 80 to 90 percent of the glucose cleared in response to insulin is taken up by muscle, and after an ordinary meal muscle still accounts for roughly 80 percent of disposal (DeFronzo & Tripathy, 2009). Because muscle carries most of the load, it is where resistance bites first — and the earliest measurable failure on the road to type 2 diabetes is impaired storage of glucose as glycogen inside the muscle cell (DeFronzo & Tripathy, 2009).
What jams the machinery is fat in the wrong place. The leading synthesis holds that when lipid accumulates inside cells not built to store it — specifically in muscle and liver — its metabolites, chiefly diacylglycerols and ceramides, interfere with the insulin signal, forming what one major review describes as a common final pathway to impaired insulin signaling (Samuel & Shulman, 2012; building on the earlier mechanistic reviews of Shulman, 2000). This is a mechanism — a plausible, well-mapped chain of events inside the cell — and it is distinct from the outcomes that follow from it.
Several of the human experiments behind that mechanism are unusually direct. When researchers raised the level of free fatty acids in the blood of nine healthy adults, whole-body glucose uptake fell to about 46 percent of control within six hours, and the block was traced to impaired glucose transport into muscle (Roden et al., 1996) — insulin resistance induced, and measured, in hours. In a separate study, young, lean, insulin-resistant adults who were the healthy offspring of people with type 2 diabetes already showed the signature: about 60 percent lower insulin-stimulated glucose uptake in muscle, about 80 percent more fat stored inside the muscle cell, and about 30 percent lower muscle mitochondrial activity than matched insulin-sensitive controls, with no difference in inflammatory markers (Petersen et al., 2004). The defect was visible in people who were neither overweight nor hyperglycemic.
The same muscle defect helps explain the blood-fat abnormalities that travel with insulin resistance. When young, lean, insulin-resistant people ate carbohydrate-rich meals, they made about 60 percent less muscle glycogen than matched controls and instead routed the energy to the liver, where fat synthesis more than doubled; plasma triglycerides rose about 60 percent and HDL cholesterol fell about 20 percent (Petersen et al., 2007). That is a clean human demonstration that muscle insulin resistance sits upstream of the classic high-triglyceride, low-HDL pattern rather than merely accompanying it.
Because liver and muscle do not resist alike, one practical point follows. Fasting glucose is set mainly by the liver's overnight output of sugar, whereas the post-meal rise is governed largely by muscle uptake — so a normal fasting glucose does not rule out muscle insulin resistance (DeFronzo & Tripathy, 2009). Fat stored in the wrong organs is itself a risk marker: an international position statement concluded that visceral fat, and ectopic fat in organs such as the liver, are independent markers of cardiovascular and metabolic risk (Neeland et al., 2019).
How insulin resistance is measured
Measuring insulin resistance well is harder than it sounds, and the choice of tool shapes the answer. The reference standard is the euglycemic-hyperinsulinemic clamp, first described in 1979: insulin is infused to hold a steady high level while glucose is infused at whatever rate keeps blood glucose constant. At steady state, that infusion rate equals the body's glucose uptake, which gives a direct measure of tissue insulin sensitivity (DeFronzo et al., 1979). Because 80 to 90 percent of the infused glucose goes to muscle, the clamp mostly reports muscle insulin action (DeFronzo & Tripathy, 2009).
The clamp is too laborious for routine use, so simpler surrogates exist, each carrying a specific blind spot (Muniyappa et al., 2008). The most common is HOMA-IR, calculated from a single fasting pair of glucose and insulin values; it was validated against the clamp and correlated closely in the original study, but it reflects mainly hepatic insulin sensitivity and carries substantial measurement variability, which makes it a signpost rather than a verdict (Matthews et al., 1985; DeFronzo & Tripathy, 2009). Cheaper flags exist too. In non-diabetic overweight adults, a triglyceride-to-HDL ratio at or above 3.0 identified insulin-resistant individuals with about 64 percent sensitivity and 68 percent specificity (McLaughlin et al., 2003) — useful as a screen, but with enough false positives and negatives, and enough dependence on the local assay, that it cannot serve as a diagnosis. Fasting insulin on its own is weaker still: in a large meta-analysis, fasting insulin was not significantly associated with coronary heart disease, whereas HOMA-IR was (Gast et al., 2012). Insulin resistance is a real, measurable quantity, but every convenient measure of it is an approximation.
Why insulin resistance comes first
The strongest claim about insulin resistance is chronological: it comes early. Long-running physiological work argues that muscle insulin resistance is the initiating defect in type 2 diabetes, present decades before the beta-cell fails and blood sugar climbs — that it is insulin resistance, not a shortage of insulin, that starts the sequence (DeFronzo & Tripathy, 2009). Prospective studies put numbers on the lead time. Following the healthy offspring of two diabetic parents for about thirteen years, one cohort study found reduced glucose clearance and compensatory high insulin already present one to two decades before any diabetes was diagnosed, pointing to a primary defect in the peripheral tissues rather than the pancreas (Warram et al., 1990). In 200 non-diabetic Pima Indians measured with the clamp and followed for about five years, insulin resistance predicted who developed diabetes independently of obesity: six-year cumulative incidence was 39 percent among those low for both insulin action and insulin response, versus essentially zero among those high for both (Lillioja et al., 1993).
The compensation that hides insulin resistance also helps entrench it. In healthy volunteers, holding insulin at a modestly elevated level for three to four days itself reduced insulin-stimulated glucose disposal by 30 to 40 percent — so the high insulin that resistance provokes is not only a response but, in part, a cause, a self-reinforcing loop (DeFronzo & Tripathy, 2009).
One honest qualification belongs beside the "decades early" claim. In the Whitehall II cohort of more than 6,500 adults, the steep and easily measured decline in insulin sensitivity clustered in the roughly five years before diagnosis, with fasting and post-load glucose rising sharply from about three years before (Tabák et al., 2009). Both things are true: resistance can be present far in advance in high-risk people, while the accelerating, clinically obvious deterioration tends to arrive late. The two describe different windows, and collapsing them into a single figure misrepresents the evidence.
What insulin resistance leads to
The consequences of insulin resistance are best read in two layers, because the evidence measures two different things and they should not be blurred together.
The first layer is the resistance index itself. In adults without diabetes, a meta-analysis of 65 studies and more than half a million people found that higher HOMA-IR carried a pooled relative risk of coronary heart disease of 1.64 — higher than the risk from fasting glucose (1.52) and clearly higher than fasting insulin, which was not a significant predictor (Gast et al., 2012). A more recent meta-analysis of 38 studies reached a similar conclusion and marked where the signal stops: higher HOMA-IR was associated with incident type 2 diabetes (hazard ratio 1.87), non-fatal major cardiovascular events (1.46), and hypertension (1.35), but showed no significant association with fatal cardiovascular events or cancer death (González-González et al., 2022). Those nulls are part of the honest picture, not a footnote to drop.
The second layer is the metabolic-syndrome cluster that insulin resistance drives. Here the effect sizes are for the cluster of co-occurring abnormalities, not for a resistance index — and the distinction matters. Insulin resistance is the upstream driver of the cluster, but it is not the variable these studies measured. A meta-analysis of 87 studies and nearly a million people found that metabolic syndrome was associated with roughly double the risk of cardiovascular disease (relative risk 2.35), a risk that persisted in people without diabetes (Mottillo et al., 2010). The link to diabetes is stronger again: across sixteen cohorts, metabolic syndrome multiplied the risk of developing type 2 diabetes some three- to fivefold, though the authors note that fasting glucose alone may predict nearly as well (Ford et al., 2008). These are what happens downstream of insulin resistance, not its own measured risk.
The liver has now been folded formally into this picture. In 2023 a multisociety consensus renamed the common form of fatty liver MASLD — metabolic dysfunction-associated steatotic liver disease — and made the presence of a cardiometabolic risk factor part of the diagnosis, tying liver fat explicitly to the insulin-resistant state (Rinella et al., 2023). That is a matter of definition rather than an outcome study; the mechanistic thread linking muscle resistance, hepatic fat synthesis, and the lipid abnormalities was drawn earlier (Samuel & Shulman, 2012; Petersen et al., 2007).
What improves insulin resistance
Because insulin resistance is a functional state rather than fixed damage, it can move — and the interventional evidence, reported here as what the studies observed rather than as advice, is unusually strong.
Exercise acts on the core defect directly. Pooling randomized trials that measured glucose disposal with the clamp, exercise training produced a clear improvement in insulin-stimulated glucose uptake, with the largest gains when training was accompanied by weight loss (Rebello et al., 2023). Weight loss and activity together also change the clinical trajectory: in the Diabetes Prevention Program, a randomized trial in more than 3,000 adults with elevated glucose, a program targeting modest weight loss and about 150 minutes of weekly activity cut new-onset diabetes by 58 percent over roughly three years, outperforming the drug metformin (Knowler et al., 2002). And substantial weight loss can reverse early disease: in the DiRECT trial, an intensive weight-management program achieved diabetes remission in 46 percent of participants versus 4 percent of controls at one year, with remission tracking the amount of weight lost — from essentially none in those who gained weight to 86 percent in those who lost 15 kilograms or more (Lean et al., 2018). At two years, remission held in 36 percent versus 3 percent (Lean et al., 2019). The core defect, at least early, is modifiable.
Sleep points the same way, with a lighter weight of evidence. In a small controlled crossover study, two weeks of restricted sleep measurably lowered insulin sensitivity and glucose tolerance in eleven healthy adults (Nedeltcheva et al., 2009) — enough to support the plausibility of a sleep-metabolism link, not enough to speak to population outcomes. None of these findings is a prescription; each is what a particular study measured under its own conditions.
What remains uncertain
Several open questions belong beside the confidence. There is no single agreed threshold for calling someone "insulin resistant": the surrogate markers all have population- and assay-dependent cut points and only moderate accuracy against the clamp, and insulin assays are not standardized across laboratories (Muniyappa et al., 2008; Matthews et al., 1985; McLaughlin et al., 2003). The label depends on the ruler.
The timing, as above, is a spectrum rather than a fixed number — "present for decades" and "steep decline in the last five years" are both supported and describe different windows (Warram et al., 1990; Tabák et al., 2009). The direction of causation is settled only where an experiment settled it: the exercise, fatty-acid-infusion, sustained-hyperinsulinemia, and weight-loss studies license causal language for exactly what they manipulated, whereas the large links between a resistance index or the metabolic-syndrome cluster and later disease are observational associations (Rebello et al., 2023; Roden et al., 1996; Gast et al., 2012; Mottillo et al., 2010). Even the cellular mechanism is not fully closed: whether the fat inside the muscle cell drives the mitochondrial shortfall or the reverse is unresolved — as one review puts it, it is unclear which is cart and which is horse — and the diacylglycerol-and-ceramide model, though the leading synthesis, is not the last word (DeFronzo & Tripathy, 2009; Samuel & Shulman, 2012).
The common misunderstanding
The most common error is to treat insulin resistance as a heavy person's problem, readable off the bathroom scale. It is not. The metabolically obese, normal-weight phenotype — sometimes described as "thin outside, fat inside" — refers to people with an ordinary body mass index who are nonetheless hyperinsulinemic, insulin-resistant, and predisposed to type 2 diabetes, high triglycerides, and premature coronary disease; it was characterized decades ago and is common in the general population (Ruderman et al., 1998). The reverse also occurs: some people carrying excess weight have, for a time, relatively preserved insulin sensitivity. Body mass is one input to insulin resistance, and an important one, but it is a poor proxy in both directions. What defines the state is how the tissues respond to insulin — not how the body looks.
This review summarizes published human evidence through 2023 on what insulin resistance is, how it develops and is measured, why it precedes high blood sugar, what it predicts, and what has been shown to improve it. Throughout, a plausible mechanism is kept separate from a demonstrated human outcome, and effect sizes measured on a resistance index such as HOMA-IR are distinguished from those measured on the broader metabolic-syndrome cluster that insulin resistance drives. It is educational and is not medical advice, a diagnosis, or a treatment plan; the study parameters cited are reported with the population and design that produced them, and no dose, route, or schedule is recommended. For the wider context, see What Is Metabolic Health? and What Is GLP-1 and How Does It Work?, and browse the Metabolic health hub.
References
- 1.DeFronzo RA, Tobin JD, Andres R. Glucose clamp technique: a method for quantifying insulin secretion and resistance. Am J Physiol. 1979;237(3):E214-E223. doi:10.1152/ajpendo.1979.237.3.E214
- 2.DeFronzo RA, Tripathy D. Skeletal muscle insulin resistance is the primary defect in type 2 diabetes. Diabetes Care. 2009;32(Suppl 2):S157-S163. doi:10.2337/dc09-S302
- 3.Ford ES, Li C, Sattar N. Metabolic syndrome and incident diabetes: current state of the evidence. Diabetes Care. 2008;31(9):1898-1904. doi:10.2337/dc08-0423
- 4.Gast KB, Tjeerdema N, Stijnen T, Smit JWA, Dekkers OM. Insulin resistance and risk of incident cardiovascular events in adults without diabetes: meta-analysis. PLoS One. 2012;7(12):e52036. doi:10.1371/journal.pone.0052036
- 5.González-González JG, Violante-Cumpa JR, Zambrano-Lucio M, et al. HOMA-IR as a predictor of health outcomes in patients with metabolic risk factors: a systematic review and meta-analysis. High Blood Press Cardiovasc Prev. 2022;29(6):547-564. doi:10.1007/s40292-022-00542-5
- 6.Knowler WC, Barrett-Connor E, Fowler SE, et al. Reduction in the incidence of type 2 diabetes with lifestyle intervention or metformin. N Engl J Med. 2002;346(6):393-403. doi:10.1056/NEJMoa012512
- 7.Lean MEJ, Leslie WS, Barnes AC, et al. Primary care-led weight management for remission of type 2 diabetes (DiRECT): an open-label, cluster-randomised trial. Lancet. 2018;391(10120):541-551. doi:10.1016/S0140-6736(17)33102-1
- 8.Lean MEJ, Leslie WS, Barnes AC, et al. Durability of a primary care-led weight-management intervention for remission of type 2 diabetes: 2-year results of the DiRECT trial. Lancet Diabetes Endocrinol. 2019;7(5):344-355. doi:10.1016/S2213-8587(19)30068-3
- 9.Lillioja S, Mott DM, Spraul M, et al. Insulin resistance and insulin secretory dysfunction as precursors of non-insulin-dependent diabetes mellitus: prospective studies of Pima Indians. N Engl J Med. 1993;329(27):1988-1992. doi:10.1056/NEJM199312303292703
- 10.Matthews DR, Hosker JP, Rudenski AS, et al. Homeostasis model assessment: insulin resistance and beta-cell function from fasting plasma glucose and insulin concentrations in man. Diabetologia. 1985;28(7):412-419. doi:10.1007/BF00280883
- 11.McLaughlin T, Abbasi F, Cheal K, et al. Use of metabolic markers to identify overweight individuals who are insulin resistant. Ann Intern Med. 2003;139(10):802-809. doi:10.7326/0003-4819-139-10-200311180-00007
- 12.Mottillo S, Filion KB, Genest J, et al. The metabolic syndrome and cardiovascular risk: a systematic review and meta-analysis. J Am Coll Cardiol. 2010;56(14):1113-1132. doi:10.1016/j.jacc.2010.05.034
- 13.Muniyappa R, Lee S, Chen H, Quon MJ. Current approaches for assessing insulin sensitivity and resistance in vivo: advantages, limitations, and appropriate usage. Am J Physiol Endocrinol Metab. 2008;294(1):E15-E26. doi:10.1152/ajpendo.00645.2007
- 14.Nedeltcheva AV, Kessler L, Imperial J, Penev PD. Exposure to recurrent sleep restriction results in increased insulin resistance and reduced glucose tolerance. J Clin Endocrinol Metab. 2009;94(9):3242-3250. doi:10.1210/jc.2009-0483
- 15.Neeland IJ, Ross R, Després JP, et al. Visceral and ectopic fat, atherosclerosis, and cardiometabolic disease: a position statement. Lancet Diabetes Endocrinol. 2019;7(9):715-725. doi:10.1016/S2213-8587(19)30084-1
- 16.Petersen KF, Dufour S, Befroy D, Garcia R, Shulman GI. Impaired mitochondrial activity in the insulin-resistant offspring of patients with type 2 diabetes. N Engl J Med. 2004;350(7):664-671. doi:10.1056/NEJMoa031314
- 17.Petersen KF, Dufour S, Savage DB, et al. The role of skeletal muscle insulin resistance in the pathogenesis of the metabolic syndrome. Proc Natl Acad Sci U S A. 2007;104(31):12587-12594. doi:10.1073/pnas.0705408104
- 18.Reaven GM. Banting lecture 1988: role of insulin resistance in human disease. Diabetes. 1988;37(12):1595-1607. doi:10.2337/diab.37.12.1595
- 19.Rebello CJ, Zhang D, Kirwan JP, et al. Effect of exercise training on insulin-stimulated glucose disposal: a systematic review and meta-analysis of randomized controlled trials. Int J Obes (Lond). 2023;47(5):348-357. doi:10.1038/s41366-023-01283-8
- 20.Rinella ME, Lazarus JV, Ratziu V, et al. A multisociety Delphi consensus statement on new fatty liver disease nomenclature. Hepatology. 2023;78(6):1966-1986. doi:10.1097/HEP.0000000000000520
- 21.Roden M, Price TB, Perseghin G, et al. Mechanism of free fatty acid-induced insulin resistance in humans. J Clin Invest. 1996;97(12):2859-2865. doi:10.1172/JCI118742
- 22.Ruderman N, Chisholm D, Pi-Sunyer X, Schneider S. The metabolically obese, normal-weight individual revisited. Diabetes. 1998;47(5):699-713. doi:10.2337/diabetes.47.5.699
- 23.Samuel VT, Shulman GI. Mechanisms for insulin resistance: common threads and missing links. Cell. 2012;148(5):852-871. doi:10.1016/j.cell.2012.02.017
- 24.Shulman GI. Cellular mechanisms of insulin resistance. J Clin Invest. 2000;106(2):171-176. doi:10.1172/JCI10583
- 25.Tabák AG, Jokela M, Akbaraly TN, et al. Trajectories of glycaemia, insulin sensitivity, and insulin secretion before diagnosis of type 2 diabetes: an analysis from the Whitehall II study. Lancet. 2009;373(9682):2215-2221. doi:10.1016/S0140-6736(09)60619-X
- 26.Warram JH, Martin BC, Krolewski AS, Soeldner JS, Kahn CR. Slow glucose removal rate and hyperinsulinemia precede the development of type II diabetes in the offspring of diabetic parents. Ann Intern Med. 1990;113(12):909-915. doi:10.7326/0003-4819-113-12-909
Disclosures
Educational review of published evidence. Not medical advice, diagnosis, or a treatment recommendation. No dose, route, or schedule is advised; study parameters are reported with the population and design that produced them.