
The Global Therapeutic Peptide Industry Markets, companies, economics, and competitive strategy
A peptide medicine is not only a sequence printed on a label. It is a scarce factory, a patent clock, a delivery device, a rebate stack, and a competitive race. This monograph explains the worldwide therapeutic-peptide industry as a scientific and commercial system — where value is created, where it is captured, why a few pens remade the mid-2020s, and why scientific success so often fails to become a durable business.
Section 01Two pens, one industrial system
On a kitchen counter, two injection pens can look like lifestyle accessories. One may carry a once-weekly incretin agonist that remade diabetes and obesity markets; the other a long-acting insulin analogue that still anchors daily life for millions. What the patient sees is a device. What the industry is, behind that device, is a chain of academic discovery, medicinal chemistry, multi-year clinical programmes, solid-phase synthesis or recombinant fermentation, brutal purification, sterile fill-finish, cold-chain logistics, patent estates, payer negotiations, and a fight for manufacturing tonnes that did not exist when the molecules were designed.202
By 2025 those tonnes had become the plot. Novo Nordisk’s company-reported semaglutide franchise sales — Ozempic DKK 127.1 billion, Wegovy DKK 79.1 billion, and oral Rybelsus DKK 22.1 billion — sat beside Eli Lilly’s tirzepatide pair (Mounjaro and Zepbound), which together contributed on the order of USD 36.5 billion in 2025 communications. Capacity investment, FDA shortage listings and their later clearance, compounding-policy clarification, CDMO expansion, and a widening competitor set (including longer-interval and dual- agonist programmes from other large sponsors) turned a clinical story into an industrial one. Those figures are filings and labelled secondary digests of filings, not a crowned “peptide market size.”
This monograph is about that chain. It is not a directory of companies, though companies appear as evidence. It is not a market-research brochure that picks one headline number and calls it truth. And it is not a passport manual for product status — that problem belongs to General Peptide Monograph 11. Here the question is economic and strategic: how large is this industry, who controls its scarce steps, why some peptide medicines become franchises while others remain elegant failures, and where along the value chain money and power actually settle.
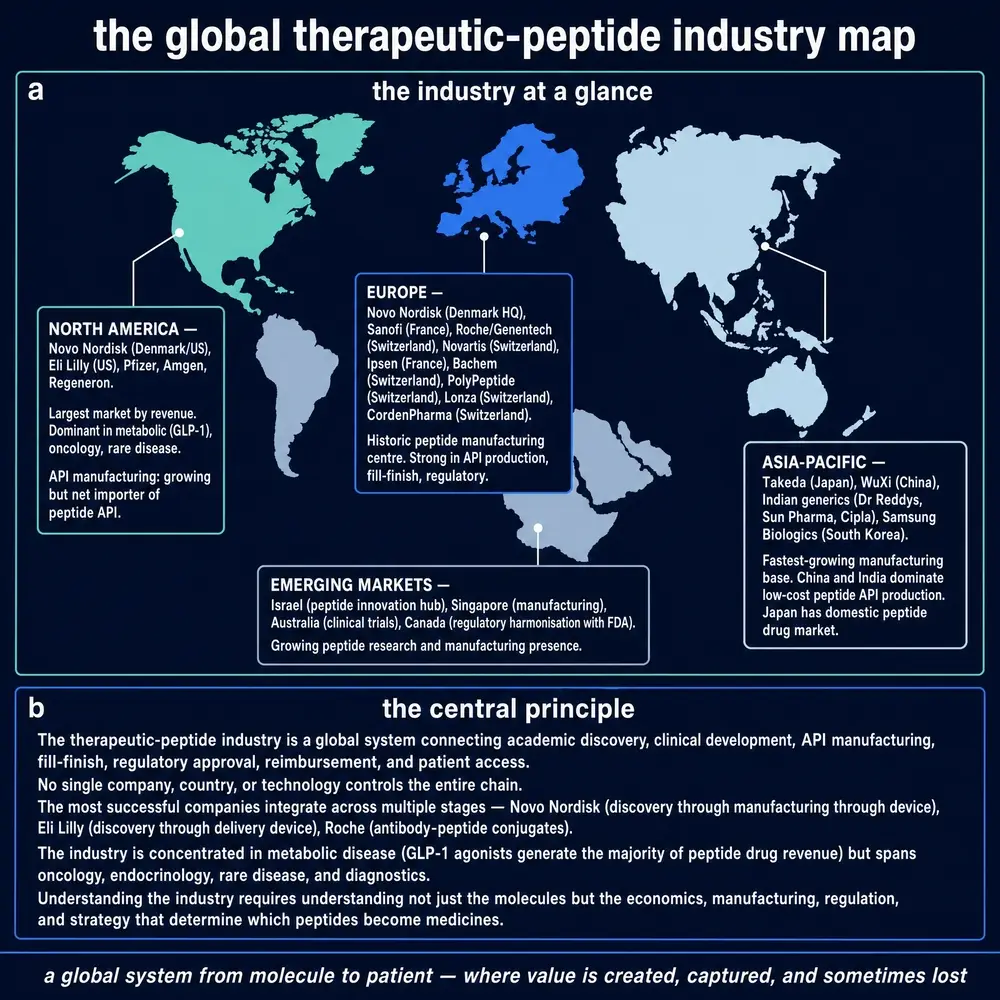
Figure 1 separates functions that are often collapsed in casual talk. Research leadership, intellectual-property ownership, active pharmaceutical ingredient (API) production, fill-finish capacity, domestic market size and export importance do not live in the same places. Denmark can host franchise headquarters while fill-finish bottlenecks sit elsewhere; China and India can matter enormously for API scale without owning the brands that capture most list-price narrative; the United States can dominate realised revenue while Switzerland concentrates peptide contract manufacturing know-how. Geography in this industry is a map of roles, not a single ranking.
Reported sales are audited product or franchise figures from company filings. Estimated market totals are syndicated research products with incompatible definitions. Author inference is labelled as such. Approved medicine, compounded copy, and research-use-only catalog material are different legal and quality worlds (see GPM 11); commercial chatter that treats them as interchangeable is not evidence.
Section 02What “the peptide market” does and does not mean
Ask five reports for the size of the therapeutic-peptide market in 2025 and you can receive answers that disagree by roughly a factor of three. Narrower therapeutics framings cluster near the high tens of billions of US dollars; broader peptide framings climb toward or past one hundred forty billion; some GLP-1 segment estimates alone rival or exceed the narrower “whole market” figures.20 That is not a rounding error. It is a definition war: whether insulin counts, whether diagnostics or cosmeceuticals sneak in, whether combination products are double-counted, which geographies are covered, and whether list price or something closer to net price is imagined.
The working rule of this document follows from that definition war. Syndicated totals are treated as definition-dependent ranges, not as a single oracle number. The firmer quantitative anchors are product-level net sales from audited filings — for example Novo Nordisk’s 2025 disclosures for Ozempic (DKK 127.1 billion) and Wegovy (DKK 79.1 billion), and Eli Lilly’s 2025 disclosures for Mounjaro (USD 23.0 billion) and Zepbound (USD 13.5 billion). Those figures do not sum to “the global peptide market,” and they are not converted here into a fake common currency total without an explicit method. They do show, without mystique, that a handful of incretin franchises now move cash on a scale once reserved for the largest small-molecule blockbusters.
A second definition trap is more political than statistical. Insulin remains a peptide industry, even when modern conversation is hypnotised by obesity pens. Cost-based manufacturing analyses and access surveys in low- and middle-income countries show that oligopoly, device patents, and secondary intellectual property still shape who can afford a medicine that is a century old in concept.2183 Any account of peptide economics that starts in 2021 and never looks at insulin is telling a story about fashion, not about the industry.
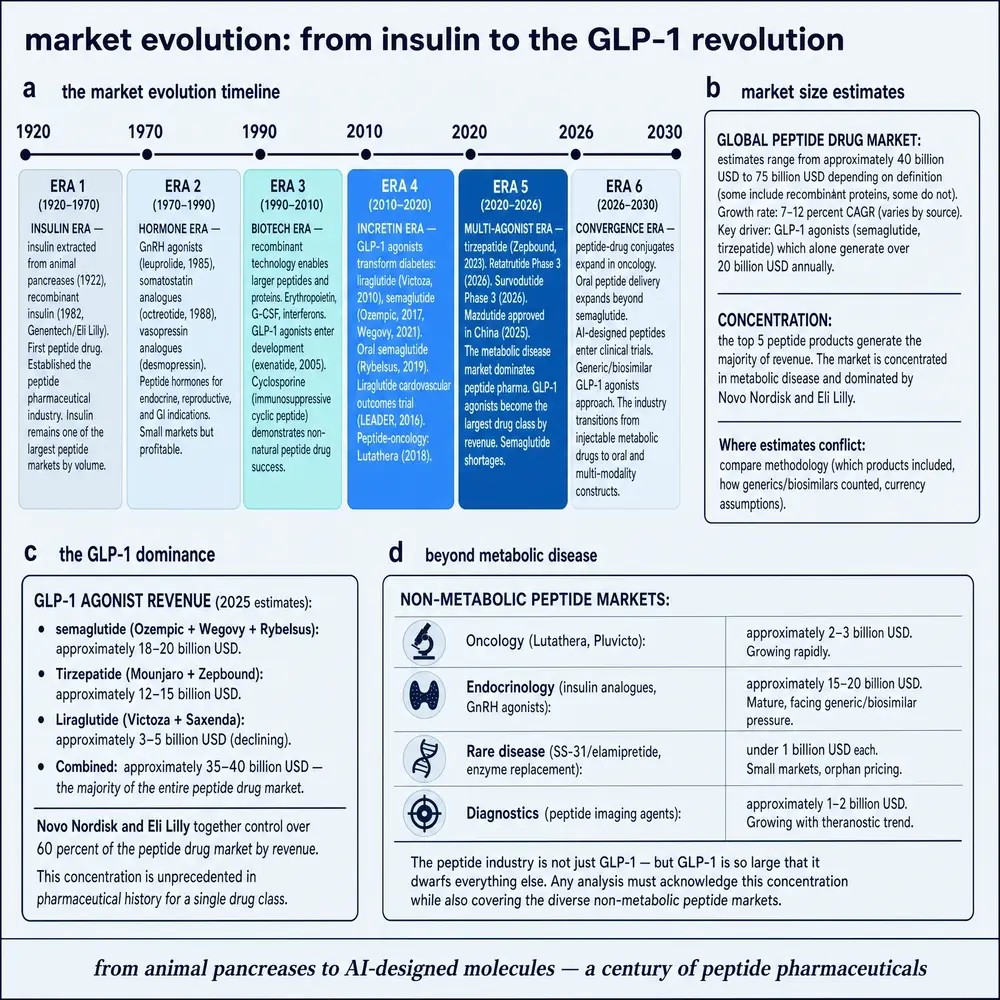
Figure 2 sketches the longer arc: industrial hormone trade; recombinant insulin; the somatostatin, gonadotropin-releasing hormone (GnRH), parathyroid and fertility peptide decades; the exenatide seed; then the weekly incretin franchise era. The point of the timeline is not nostalgia. It is to show that today’s margins and shortages are the latest chapter of an old industrial problem — how to make a fragile biological message stable, injectable or swallowable, reimbursable, and available in quantity.
Section 03How to read the evidence in this monograph
An industry monograph mixes kinds of fact that must not be treated as interchangeable. Company filings and audited segment disclosures are the hardest commercial numbers in what follows: they name what a sponsor reported for a franchise, geography or modality in a stated period. Regulator documents — approvals, shortage lists, compounding alerts, antitrust actions — establish what authorities have said about access, quality and conduct. Peer-reviewed literature supplies manufacturing economics, access studies, competitive case histories and technology assessments when those papers actually analyse industry structure rather than only clinical efficacy. Secondary market reporting (syndicated totals, press summaries of deal values, analyst estimates) may frame scale where filings are silent; it is labelled as secondary whenever it appears.
A second distinction matters for the grey edge of demand. Research-chemical catalogs, compounded copies and unlicensed online storefronts are real commercial phenomena around some peptide classes, especially metabolic products. They are not the same economy as approved, reimbursed franchise sales. Where this monograph discusses those adjacent channels, it names them as such and does not fold their turnover into therapeutic market totals.
Financial, patent, pipeline and regulatory information was reviewed through 5 August 2026. Absence of a public filing or open paper is not proof that a deal or programme does not exist; it is only a limit on what can be cited here.
Section 04Insulin: the founding factory
The therapeutic-peptide industry begins, industrially if not philosophically, with insulin. The 1921–23 discovery story is familiar; the industrial sequel is what made a market. Extraction from animal pancreata created a global trade in a life-saving peptide long before solid-phase synthesis existed. Recombinant production — Genentech’s cloning work commercialised with Eli Lilly in the early 1980s — then changed the supply physics: fermentation and downstream processing could, in principle, outrun slaughterhouse logistics.21 Downstream processing of recombinant insulin remains a case study in why “making the protein” is not the same as releasing a medicine: inclusion bodies or secreted product, refolding, chromatography trains, and the brutal economics of yield still decide cost.
That history matters because it prefigures every later peptide franchise. Insulin taught companies that chronic daily (later weekly-adjacent) therapy could fund enormous manufacturing systems; that devices and cartridges would become competitive weapons; and that secondary patents and formulation tricks could outlive the romance of the original sequence.2 Biosimilar and interchangeable insulin products now stress-test those lessons in real time across Europe, Africa, South Asia and North America, with price and market- share studies showing that “competition” is not a switch that flips when a compound patent expires.15148
Figure 2 places insulin beside later inflection points on the commissioned market-evolution plate. That timeline is a scaffold for industrial memory, not a museum wall.
Section 05Synthesis, analogues, and the second wave
Bruce Merrifield’s solid-phase peptide synthesis (SPPS) made a different kind of industry thinkable: not only recombinant copies of natural hormones, but engineered analogues that nature never secreted. The late twentieth century filled formularies with GnRH agonists and antagonists, somatostatin analogues, calcitonin products, fertility peptides, and parathyroid hormone analogues. These were not always glamorous in the modern press, but they trained the industry in three enduring crafts: medicinal chemistry on peptide scaffolds, depot and device delivery, and specialty-pharmacy commercialisation for endocrinology and oncology-adjacent care.
Somatostatin analogues such as octreotide and lanreotide illustrate a non- metabolic business model that still matters: rarer indications, depot injections, hospital and specialty channels, and later radioligand strategies that turn a peptide’s targeting into a nuclear medicine franchise. Fertility peptides and certain obstetric uterotonics — including heat-stable carbetocin in humanitarian settings — show another face of peptide economics: cost- effectiveness and supply integrity can matter as much as brand storytelling when the buyer is a health system rather than a lifestyle market.17
Oncology and radiopharmaceutical peptides sit in yet another pocket. They may never match incretin cash flows and still command strategic investment because they occupy a different competitive set — imaging, theranostics, and hospital procurement — with manufacturing constraints (chelation, radionuclide supply) that look nothing like a weekly obesity pen line.
Section 06From lizard venom to weekly pens
Exendin-4, isolated from the Gila monster and developed as exenatide, is the origin myth of the modern incretin drug class. The industrial lesson is sharper than the folklore: a peptide with inconvenient pharmacokinetics can seed a franchise only if half-life extension, formulation and device engineering turn it into something patients and payers can live with. Liraglutide’s daily injection era and semaglutide’s weekly era are not merely clinical upgrades; they are manufacturing and adherence redesigns that changed the addressable market.2013
Dual and multi-receptor agonism — tirzepatide’s GIP/GLP-1 design among them — then shifted competition from “who has a GLP-1” to “who owns the best unimolecular polypharmacology and the capacity to supply it.”412 Oral enhancer strategies add another strategic layer. SNAC-enabled oral semaglutide (Rybelsus) is no longer a curiosity: Novo’s 2025 company reporting places Rybelsus sales at DKK 22.1 billion — smaller than the weekly pens, large enough to prove that a permeation-enhancer oral peptide can clear real commercial volume. Later oral obesity presentations disclosed by manufacturers do not abolish injectables, but they change channel politics, adherence stories and patient segmentation.16 Reviews of oral peptide delivery remain blunt about negative selection: most systemic oral peptide dreams still die for pharmacokinetic reasons, which is precisely why the rare exceptions become strategic assets rather than general platforms.
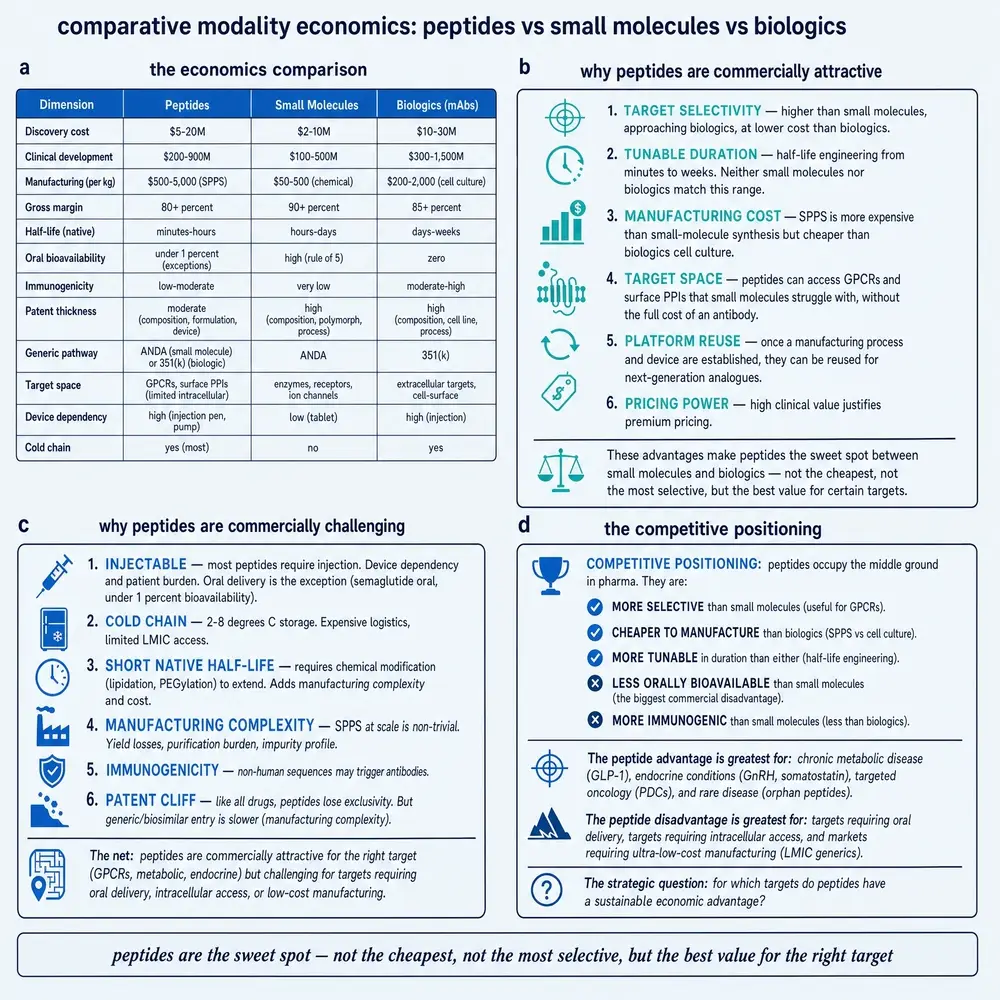
Figure 3 places peptides between small molecules and antibodies/RNA modalities. The middle position is the industrial truth: more biologically specific than many pills, usually less complex than monoclonal antibodies, taxed by injection and purification, and newly threatened by oral small-molecule incretin candidates that aim to steal the franchise without stealing the peptide factory. Displacement risk is real; so is the counter- risk that oral small molecules bring their own safety, adherence and manufacturing stories. The monograph returns to that contest in Part Five.
Section 07Physiology as market structure
A brief physiological reminder is not a dosing guide. Incretin biology — GLP-1 and GIP receptor pathways, glucose-dependent insulinotropism, effects on appetite and gastric emptying — explains why chronic metabolic disease became the cash engine of the peptide industry.196 Endocrine feedback loops explain why GnRH analogues, somatostatin analogues and growth-hormone–axis peptides found durable niches. Bone remodelling biology explains teriparatide-class products. None of that physiology recommends a human regimen here. It explains why payers, over decades, learned to buy peptides for some diseases and not others — and why the obesity market, once politically and culturally fraught, could suddenly clear enormous volume when efficacy, weekly devices and celebrity attention arrived together.
History’s warning is symmetrical. Elamipretide’s mitochondrial myopathy programme, among other specialty peptides, shows that compelling mechanistic stories and serious clinical effort do not automatically create mass-market economics.10 The industry is a filter. Biology proposes; manufacturing, regulation and reimbursement dispose.
Section 08How to read a market-size claim
Start with suspicion, then demand a definition. A 2025 peptide-therapeutics total near USD 50 billion and another near USD 141 billion can both be “sourced” in secondary literature while describing different baskets. Recent syndicated digests clustering near USD 140.9 billion for 2025 (with long-run projections toward ~USD 295 billion by the early 2030s) sit in the broad- basket family; narrower prescription-peptide digests remain nearer the USD 47–53 billion band. GLP-1 segment estimates can exceed some “whole market” figures because the segment is measured with one method and the whole with another. This monograph therefore refuses a single crowned number. It uses ranges for syndicated estimates and prefers audited franchise sales for argument.
| Anchor (2025) | Reported figure | Type | Source class |
|---|---|---|---|
| Ozempic sales | DKK 127.1B | Company-reported | Novo AR / 20-F |
| Wegovy sales | DKK 79.1B | Company-reported | Novo AR / 20-F |
| Rybelsus sales | DKK 22.1B | Company-reported | Novo AR / 20-F |
| Obesity care (Novo) | DKK 82.3B | Company-reported | Novo AR |
| Mounjaro sales | USD 23.0B | Company-reported | Lilly FY2025 |
| Zepbound sales | USD 13.5B | Company-reported | Lilly FY2025 |
| Tirzepatide pair (combined) | ~USD 36.5B | Company-reported sum | Lilly FY2025 digests |
| Lilly total revenue | USD 65.2B | Company-reported | Lilly FY2025 |
| Narrow peptide market digests | ~USD 47–53B | Estimate | Secondary |
| Broad peptide market digests | ~USD 140.9B | Estimate | Secondary |
Novo Nordisk also reported that the global branded GLP-1 obesity market grew 104% by volume in 2025 and that its branded volume share was 59.6% — a company framing that already warns how contested “share” becomes when competitors’ obesity sales are classified differently in syndicated audits. Lilly’s FY2025 results show tirzepatide products as the core of a company that grew total revenue on the order of 45% year on year, with Mounjaro and Zepbound together on the order of USD 36.5 billion. These are not vibes. They are filings (and labelled digests of filings). They also do not license the inference that “peptides” as a class grew at the same rate; insulin and older endocrine peptides have slower, more contested trajectories shaped by biosimilars and tendering.159
Figure 2 already carries the concentration warning for the rest of the monograph. A few pens carry most of the new cash. The long peptide tail — endocrinology, oncology, gastrointestinal, fertility, bone, rare disease — still employs people, fills plants, and teaches strategy. It must not be edited out of existence because it photographs less well.
Section 09Therapeutic-area economics
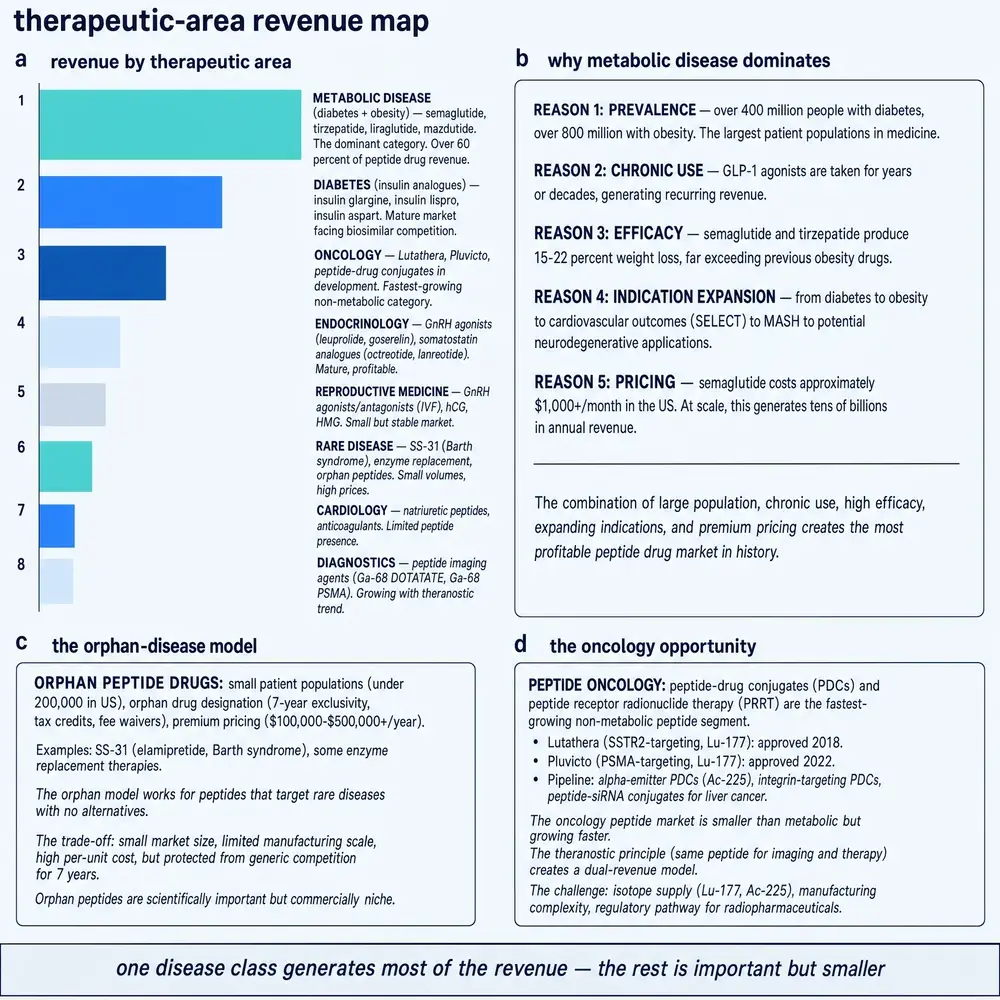
Diabetes and obesity. The present centre of gravity. Weekly incretin agonists converted metabolic disease into a specialty-meets-mass-market hybrid: enormous volumes, brand wars, telehealth and compounding side-channels, and capital expenditure races.120 Comparative effectiveness work on tirzepatide versus semaglutide in routine US practice is already part of the competitive literature, not only the clinical literature.12 The competitive set is widening beyond the two pens: secondary reporting on Amgen’s MariTide (a peptide–antibody conjugate aimed at longer dosing intervals) and Roche/Carmot dual-agonist programmes such as CT-388 (Phase 2 weight-loss data widely summarised in 2025–2026 trade coverage) shows how other large sponsors are trying to buy into the same metabolic cash pool with different PK and device stories. Those programmes are pipeline competition, not 2025 franchise revenue.
Endocrinology beyond incretins. Growth-hormone–axis products, thyroid- related peptides, and older hormone analogues remain commercially meaningful even when they no longer dominate headlines. Their economics often depend on device convenience, pediatric versus adult channels, and payer skepticism about expansion uses.
Oncology and radioligands. Peptide receptor radionuclide therapy and related conjugates are strategically hot because they attach peptide targeting to a different payment and manufacturing system. Revenue concentration is lower than metabolic franchises; technical barriers and hospital infrastructure are higher.
Bone, fertility, gastrointestinal. Teriparatide-class bone anabolics, fertility peptides, and GI secretagogues (for example linaclotide-class products in the broader peptide story) illustrate specialty markets with different sales forces and different generic pressures. Heat-stable obstetric peptides show humanitarian procurement logic rather than DTC logic.17
Rare disease. High list prices, small populations, fragile supply, and intense scrutiny when shortages hit. A rare-disease peptide can be existentially important to patients and still look like a rounding error beside Wegovy — which is exactly why a serious industry map keeps it visible.
Infectious disease, immunology, neurology, pain, haematology, diagnostics. Selective peptide successes and many failures. These areas matter for pipeline optionality and for modality competition; they do not currently rival metabolic cash. Treating them as “soon to be the next Ozempic” without capacity, payer and clinical evidence is marketing, not analysis.
Section 10Geography: roles, not trophies
Figure 1 already maps regional roles; the paragraphs below unpack the same geography in prose rather than repeating a second plate.
United States. Largest commercial prize for incretin franchises; complex gross-to-net structure; three major wholesalers as critical customers for large manufacturers; telehealth and compounding politics; Medicare/Medicaid and employer coverage as demand switches. Lilly’s 10-K disclosures on wholesaler concentration are a reminder that distribution power is part of peptide economics, not an afterthought.
Europe, United Kingdom, Switzerland, Denmark. Reimbursement and health- technology assessment discipline; deep peptide manufacturing and CDMO tradition; Novo Nordisk’s Danish franchise centre of gravity; Swiss and German API/CDMO strength. Biosimilar insulin price trajectories in European markets show how tendering can compress realised price even when molecules remain clinically central.1511
China and India. API scale, rising innovative pipelines, volume-based procurement experiments, and export importance. China’s national volume-based procurement for insulin is an object lesson in how state buying power can reprice a peptide category.9 India’s dual role as generics powerhouse and formulation exporter sits beside a large domestic diabetes burden.
Japan, South Korea, Singapore. High-quality manufacture, careful regulators, and commercially important affluent markets. Singapore’s role is often as a hub rather than a demand giant.
Canada, Australia, Israel and others. Research nodes, selective commercial launches, and — for Israel especially — a history of peptide and drug-delivery innovation out of proportion to population size.
Section 11Channels: how peptides actually reach people
Hospital channels still matter for oncology, radioligands, some endocrine products and acute care peptides. Retail and specialty pharmacy dominate chronic metabolic and many endocrine brands. Specialty pharmacy and hub services become competitive tools when training, cold chain and reimbursement navigation are hard. Direct-to-consumer advertising and telehealth — especially in the United States — pulled obesity peptides into cultural visibility and also into regulatory grey zones when compounded copies and research-chemical storefronts tried to ride the same demand wave. Those adjacent markets are documented in peer-reviewed examinations of compounded GLP-1 commerce and in public reporting on research-chemical and telehealth channels; they are not identical to the approved franchise economy, and conflating them inflates both hope and fear.5
The shortage cycle sharpened that distinction. After 2022–2024 demand shocks, trade and regulator reporting through 2025 described Lilly and then Novo diabetes/obesity GLP-1 products largely clearing the FDA shortage list as captive capacity came online — followed by FDA clarifying statements about compounding once national supply began to stabilise. That sequence matters industrially: shortage authority temporarily redistributed volume toward compounders; stabilisation and clarifying policy pull volume back toward approved franchises. It is not proof that grey channels disappear; it is proof that manufacturing physics and regulator framing jointly set the boundary of the legal market.
Payers and pharmacy benefit managers shape realised demand as much as physicians do. Prior authorisation, step edits, and coverage exclusions can turn a clinical blockbuster into a regional disappointment. Pricing studies from South Africa, Pakistan and other settings show that “available in the world” is not the same as “accessible where the patient lives.”318
Section 12Eighteen stages, a few choke points
A complete value chain runs from academic discovery to postmarket surveillance. The useful analytical move is to cluster those stages until the choke points show.
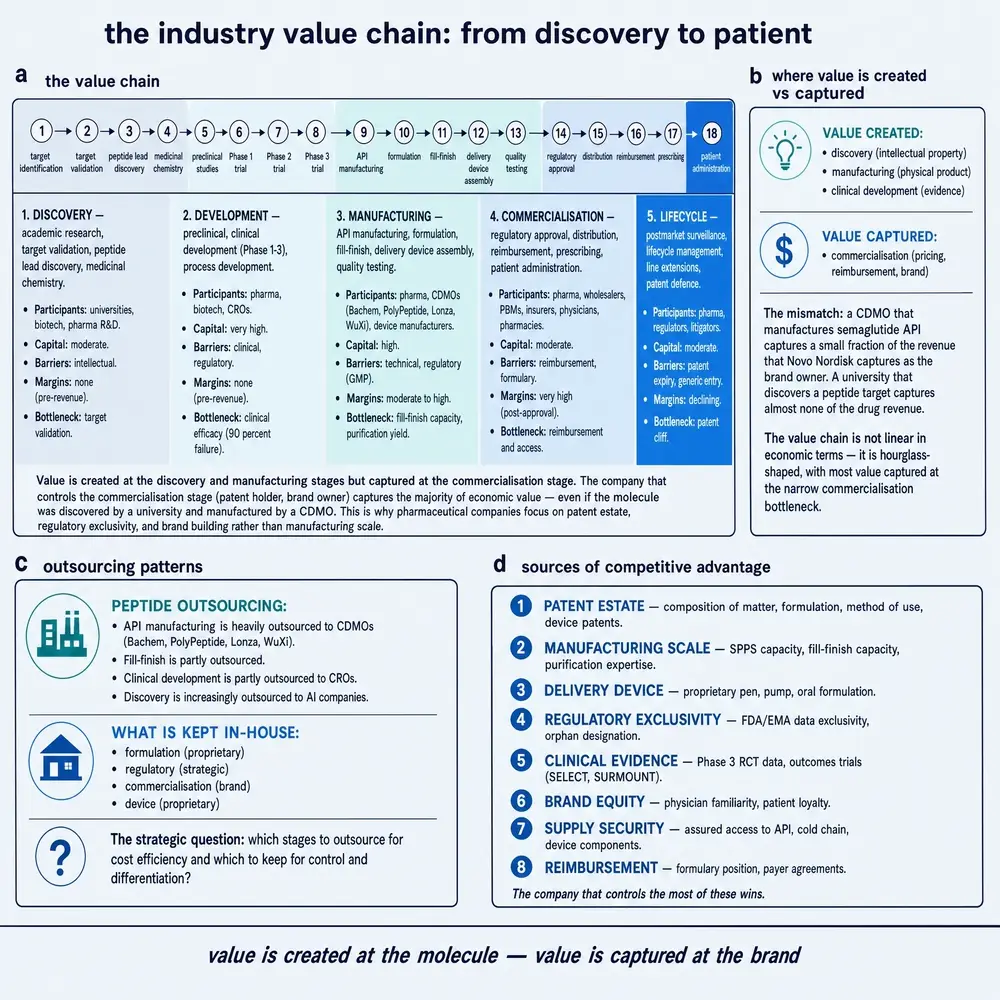
Figure 5 compresses the chain into invent, prove, process, make API, finish, assure, authorise, distribute, use and watch. Early discovery is romantic and usually poorly paid unless it is captured inside a company that already owns later stages. Clinical development burns the most cash for many sponsors. API purification and fill-finish decide whether a successful trial becomes a product on shelves. Payers decide whether a product on shelves becomes revenue. Postmarket safety can unwind everything upstream.
| Cluster | Who | Barrier | Power pattern (2024–26) |
|---|---|---|---|
| Invent | Academia, biotech, pharma discovery | Ideas abundant; validated leads scarce | Weak capture alone |
| Prove | Sponsors, CROs, trial sites | Capital + time | Value contingent on approval |
| Make API | Captive plants, CDMOs | SPPS/recombinant + purification | High when tonnes are scarce |
| Finish / devices | Captive + specialists | Sterile capacity, pen platforms | Strategic chokepoint |
| Access | Wholesalers, PBMs, HTA, pharmacies | Contracts, coverage | Gross-to-net power |
Section 13What it costs to make a peptide medicine
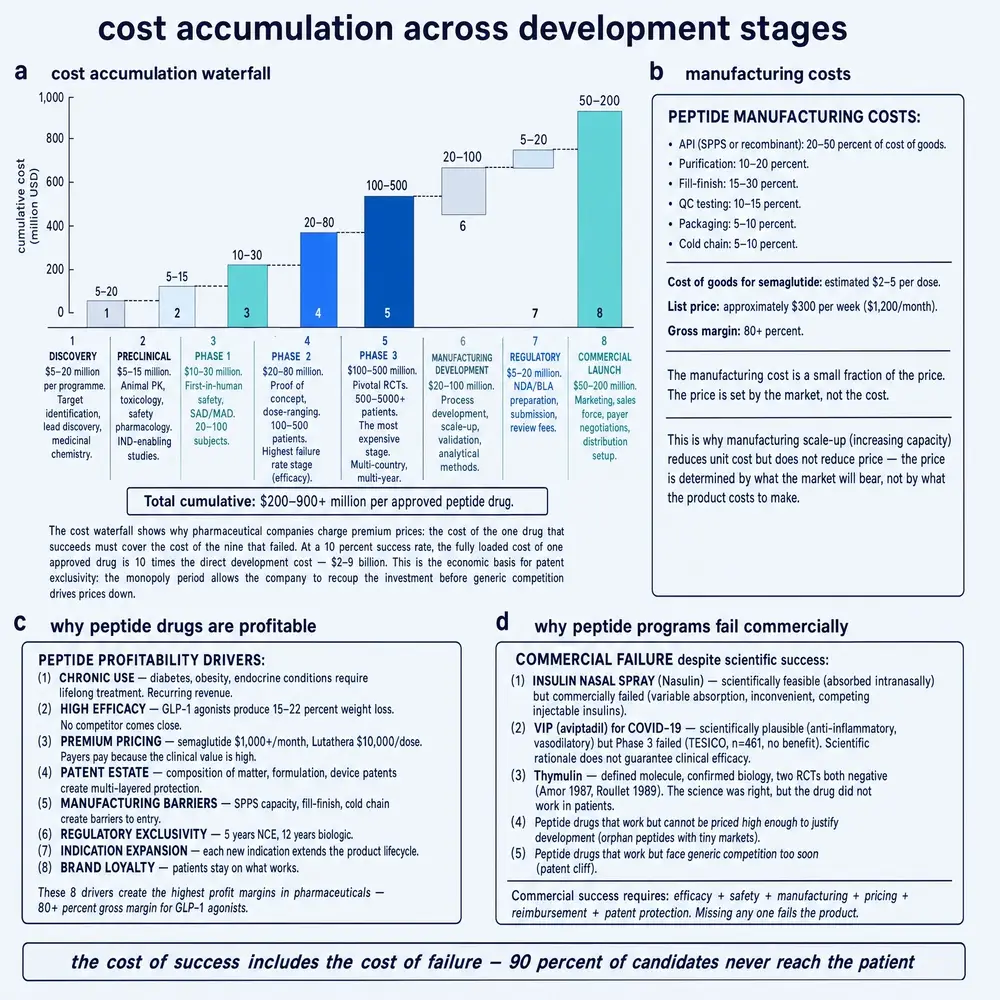
Cost accumulation is not a universal spreadsheet. It is a stack. Discovery and medicinal chemistry are real; preclinical toxicology and CMC are real; pivotal trials for chronic disease — especially cardiovascular outcome trials — can dominate cash burn; facilities and devices force capital expenditure before launch scale; launch requires sales, specialty hubs and rebate architecture; lifecycle defence funds patents, new formulations and litigation. Peptides add distinctive taxes: long synthesis or complex fermentation, purification yield losses, analytical release testing, immunogenicity programmes, cold chain, and device assembly.212
Cost-based price modelling for insulins and GLP-1 agonists suggests that competitive manufacture could, in principle, support far lower prices than many markets presently show — with estimated monthly cost-based prices for several GLP-1 agonists far below observed retail ranges in a multi-country comparison.2 That finding is a modelled floor under assumed competition, not a disclosure of Novo’s or Lilly’s actual COGS, and not a recommendation of any price. Its industrial meaning is double: first, large gross margins are structurally plausible when IP and capacity block competition; second, when competition or state procurement arrives, peptide prices can compress violently, as insulin tenders have already shown in some systems.9
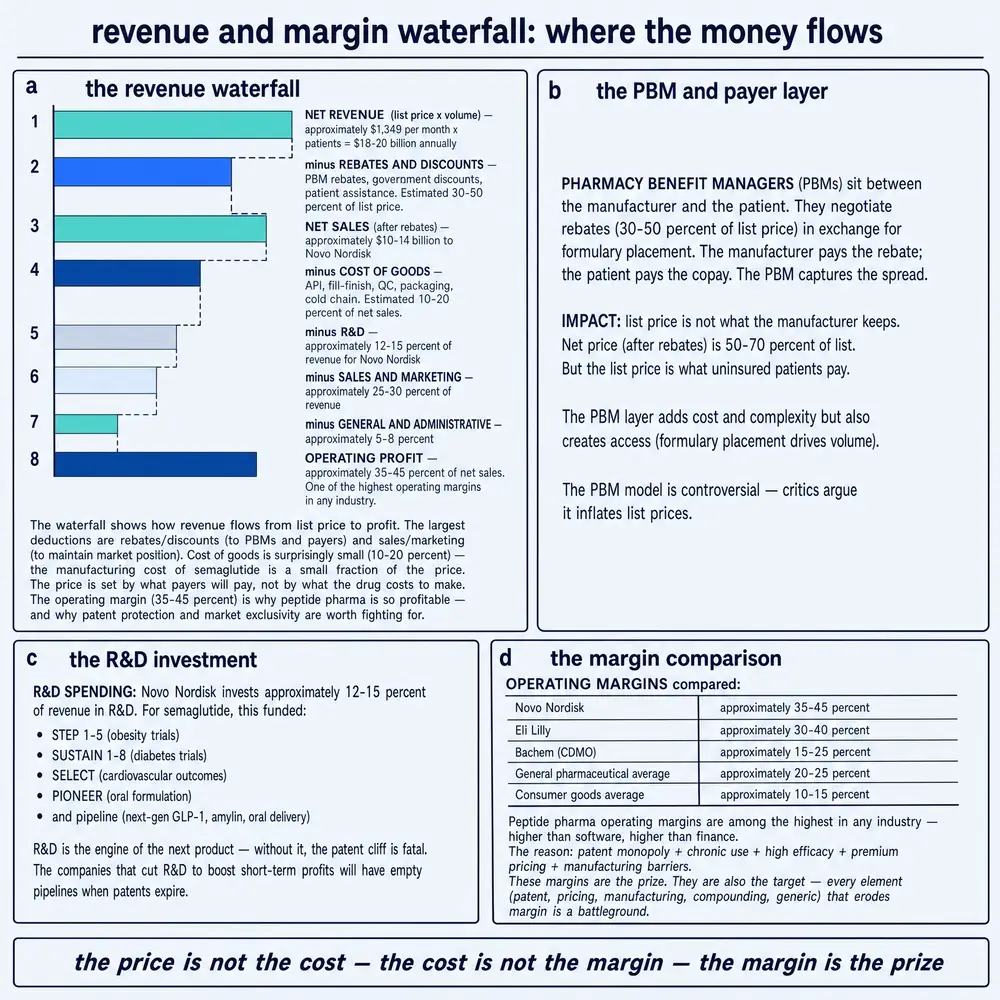
Figure 7 reminds readers that list price is a fiction until rebates, chargebacks and discounts are subtracted. US specialty markets are particularly exposed to gross-to-net erosion. Filings increasingly discuss lower realised prices even while volumes explode — a combination that can look like simultaneous triumph and margin pressure.
Section 14API, fill-finish, and the CDMO layer
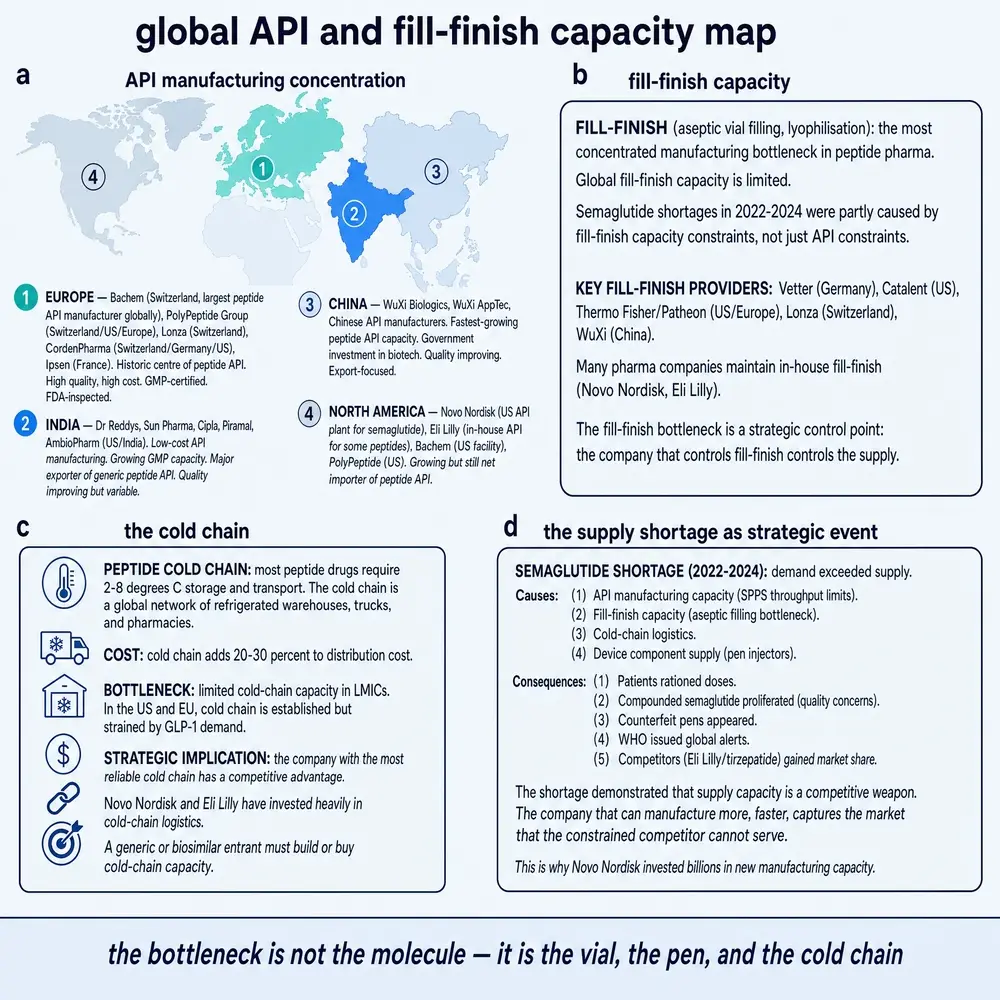
Bachem’s public communications in 2024–2026 describe a peptide CDMO industry re-tooling for ton-scale reality: CAPEX plans above CHF 400 million in successive years, Building K ramp toward commercial high-volume production, US Vista expansion plans on the order of USD 250 million over 2026–2030, a Bubendorf capacity-doubling ambition aimed toward 2026, and a Sisslerfeld greenfield commitment above CHF 500 million with commercial production aimed at 2030 under long-term customer arrangements. Those are company disclosures about capacity strategy, not third-party audits of every reactor. They matter because they show the CDMO layer betting that peptide demand is not a fad that disappears when the next press cycle moves on.
PolyPeptide Group, CordenPharma, Lonza, WuXi-related peptide businesses, AmbioPharm and others occupy overlapping but non-identical niches — Europe versus US versus Asia footprints, clinical versus commercial scale, oncology and radioligand specialisation versus metabolic tonnage. Secondary market reports should be treated cautiously for exact euro figures; the structural point is robust without them: contract manufacturing is both a flexibility valve for biotech and a queue in a boom. By mid-2026, secondary CDMO pricing analyses began to describe a mid-cycle shift: after years of supplier-side leverage under GLP-1 tightness, announced capacity additions and a more mixed demand environment started to restore some negotiating room for buyers. That is trade reporting about bargaining power, not a claim that queues have vanished.
Figure 8 names the breakage points: specialty reagents and resins, long SPPS and purification, sterile fill-finish and devices, cold chain, payer throttles, and single-source risk. The 2022–2025 incretin shortage period taught politicians and patients a lesson manufacturers already knew: demand can outrun physics. Shortages also redistribute power — toward whoever still has supply, toward compounding pharmacies operating under shortage authorities, and toward competitors ready to fill the gap when regulators and payers allow. The subsequent clearance of major branded GLP-1s from the FDA shortage list, and clarifying statements about compounding as supply stabilised, is the second half of the lesson: when captive fill-finish and API catch up, the legal market boundary moves again.
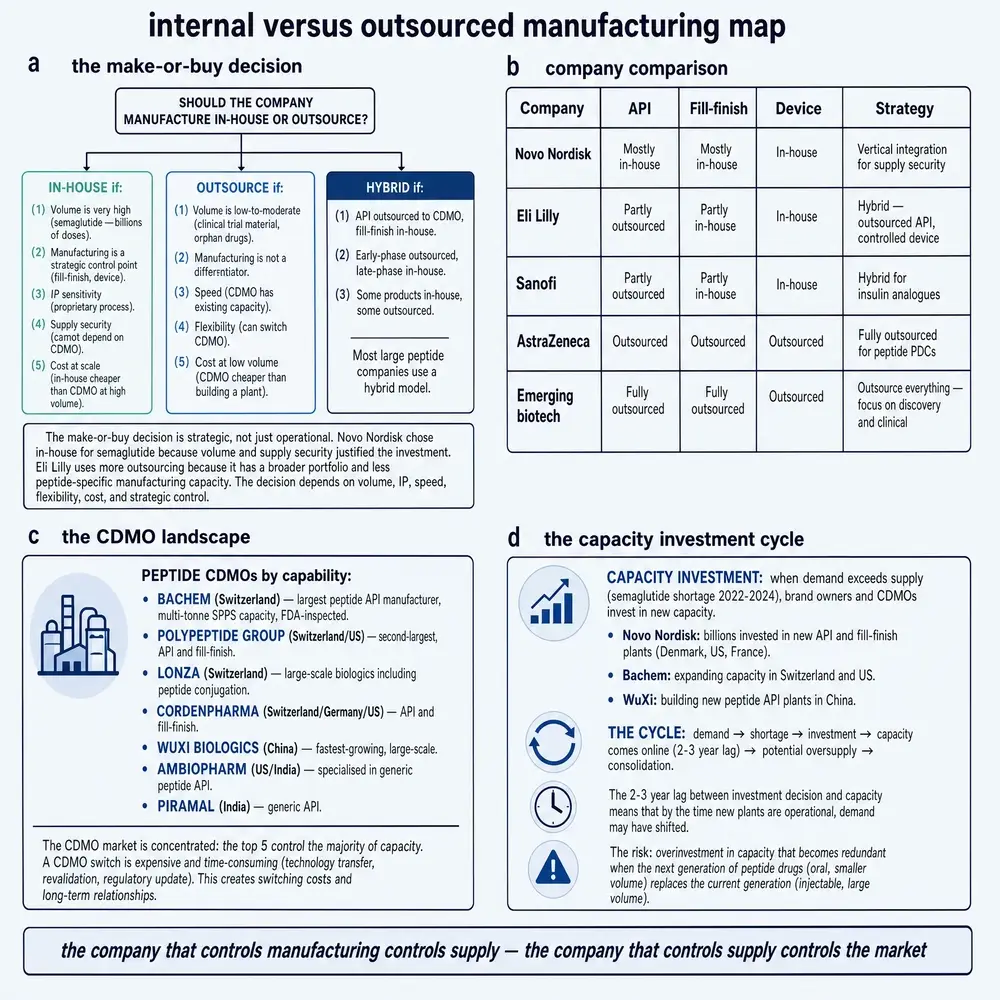
Vertical integration is the franchise owner’s bet that owning capacity is cheaper than missing sales and safer than sharing a queue. Novo Nordisk and Eli Lilly have both treated manufacturing investment as strategy, not janitorial work. Outsourcing is the biotech bet that fixed costs should stay on someone else’s balance sheet until proof arrives. Neither bet is universally right. Integration shines when demand is durable and scarce; it punishes when indications fail or reimbursement collapses. Outsourcing shines in exploration; it punishes when every sponsor calls the same CDMO in the same quarter.
Section 15Participants across the chain
Large pharmaceutical companies own most late-stage metabolic franchises. Biotechnology companies originate platforms and specialty assets. Specialty peptide companies defend niches. Generic and biosimilar manufacturers pressure insulin and, eventually, other classes. CDMOs and API makers sell scarcity management. Device manufacturers and combination-product teams sell usability and switching costs. Analytical labs and quality units sell release. Logistics firms sell integrity. CROs sell time compression in development. Universities sell beginnings. Venture capital and private equity sell narrative acceleration — sometimes disciplined, sometimes not. Wholesalers, specialty distributors, PBMs and insurers sell access, or withhold it. Each participant’s margin story differs; collapsing them into “pharma” hides where value actually sticks.
Section 16Companies as evidence, not as chapters
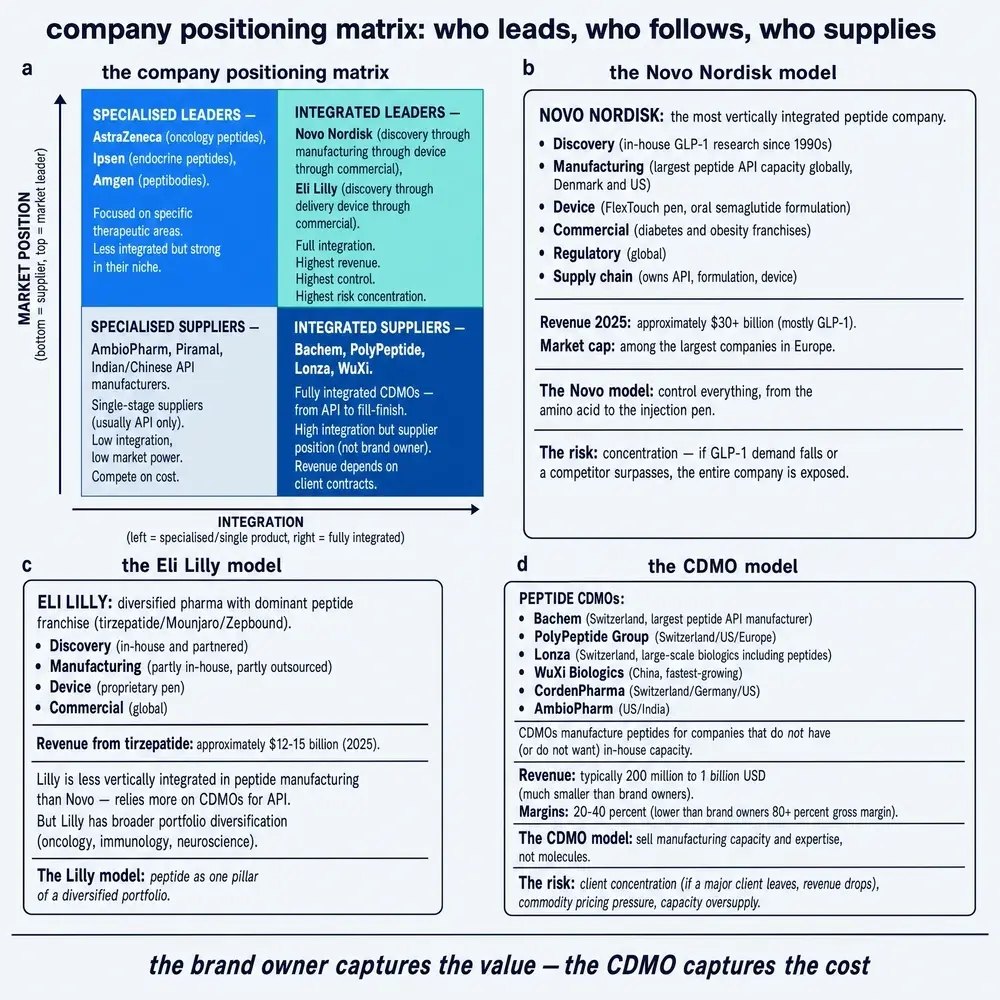
Figure 10 sorts roles: franchise owners, specialty peptide firms, CDMO/API networks, device/delivery players, generics/biosimilars, and platform biotechs. A single firm can occupy more than one cell. The list below is investigative, not honorary, and membership is checked against 2025–2026 evidence rather than memory.
Novo Nordisk. Semaglutide franchise centre; 2025 company-reported product sales of Ozempic DKK 127.1 billion, Wegovy DKK 79.1 billion and Rybelsus DKK 22.1 billion; obesity-care segment reporting around DKK 82.3 billion; manufacturing scale as strategy; oral and higher-dose lifecycle moves; rare- disease portfolio alongside metabolic dominance. Competitive risks include tirzepatide share shift, compounding while shortage authorities applied, eventual generic pressure outside thicketed markets, pricing agreements, and pipeline execution on combinations such as CagriSema disclosed in prior annual reporting. Investor materials around the 2025 close also framed a tougher 2026 outlook against competition and pricing — a reminder that franchise scale and franchise comfort are not the same thing.
Eli Lilly. Tirzepatide franchise (Mounjaro USD 23.0 billion; Zepbound USD 13.5 billion in 2025; ~USD 36.5 billion combined in FY digests); multi- receptor strategy; heavy capacity investment that helped clear shortage listings; oral small-molecule incretin ambitions (orforglipron submissions disclosed in FY2025 communications) that could cannibalise or complement injectables. Patent tables in the 10-K place Mounjaro/Zepbound compound protection deep into the 2030s in major markets — a clock, not a guarantee.
Amgen and Roche (and peers racing the same pool). Not yet 2025 franchise owners of weekly incretin pens at Novo/Lilly scale, but strategically material as challengers: Amgen’s MariTide peptide–antibody conjugate programme targets longer dosing intervals; Roche’s Carmot-origin dual-agonist work (including CT-388 Phase 2 weight-loss data summarised in 2025–2026 company and trade releases) aims at the same metabolic demand with a different asset shape. Their industrial meaning is forward competition for capacity, payers and mind- share — not a retroactive rewrite of 2025 sales tables.
Sanofi, AstraZeneca, Pfizer, Merck, Novartis, AbbVie, Takeda, Ipsen, Ferring, Ironwood, Teva, Viatris. Material where peptide products, radioligands, endocrine portfolios, GI secretagogues, insulin heritage or generics exposure still move revenue or pipeline value. Specialty names (Ipsen, Ferring, Ironwood) should be read as niche franchise evidence, not pooled into a single invented “specialty peptide total.” Several large firms are more important historically for insulin or specialty peptides than for current incretin share; that is a fact about 2026 competition, not a dismissal of their peptide roles.
Bachem, PolyPeptide Group, CordenPharma, Lonza, Thermo Fisher/Patheon, WuXi-related peptide units, AmbioPharm, Piramal and other API/CDMO players. They monetise the scarce middle of the chain. Their customers’ success is their demand forecast; their capacity decisions shape who can launch.
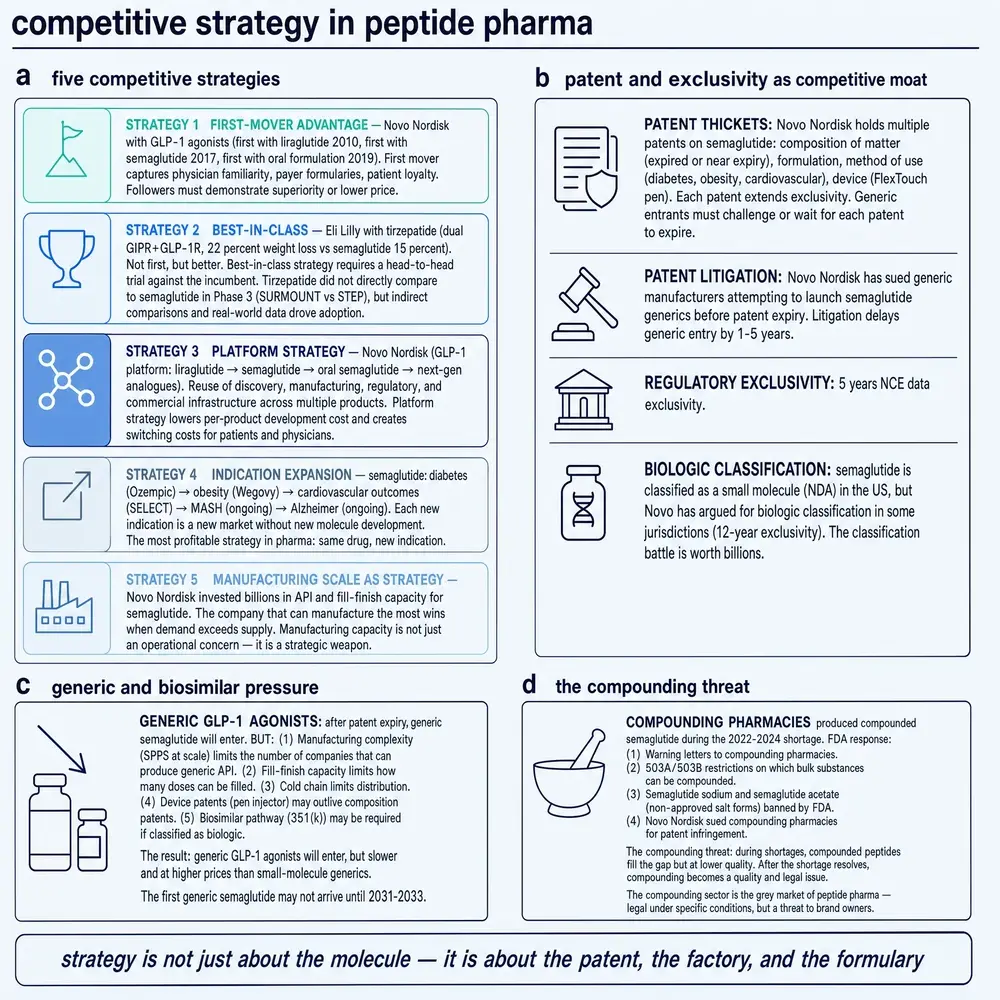
Figure 11 lists control points: composition IP, half-life and formulation IP, device IP, manufacturing know-how, capacity ownership, and payer relationships. First-mover advantage matters; best-in-class can overwrite it; fast followers need capacity and access, not only a copy; platform strategies amortise discovery; indication expansion and line extensions stretch franchises; multi-receptor agonism raises clinical bars; oral delivery and devices reshuffle channels; vertical integration and CDMO contracts are opposite answers to scarcity; licensing and M&A buy time or tonnes; patent thickets and exclusivity delay erosion; geographic pricing and telehealth redistribute demand; supply assurance itself became a brand claim during shortage years.
Section 17Case studies
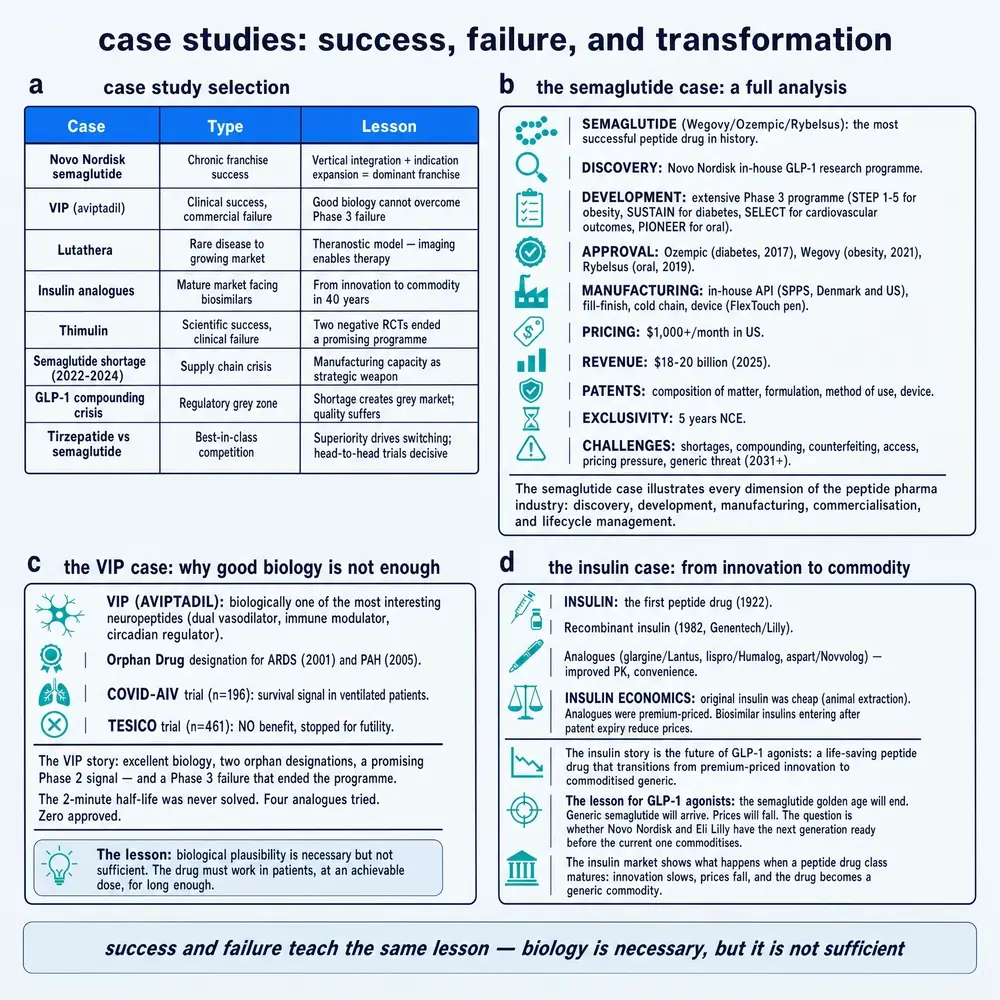
1. Chronic franchise success — semaglutide and tirzepatide. Audited 2025 sales, weekly devices, outcome data, and capacity races. The lesson is alignment: clinical differentiation plus manufacturable supply plus payer pathway.2012
2. Rare-disease / specialty peptide economics — somatostatin-analogue class. Depot injections, hospital/specialty channels, later radioligand adjacency. High clinical dependence, smaller absolute revenue than metabolic pens, and supply sensitivity that hits patients hard when disrupted.
3. Strong science, constrained uptake. Oral peptide delivery literature is full of elegant systems that fail negative selection on bioavailability; even approved boundary cases do not generalise into a universal oral peptide platform.16 Commercial uptake follows pharmacokinetics and access, not press releases.
4. Commercial disappointment despite serious programmes. Specialty peptides such as elamipretide show the gap between mechanistic promise, trial struggle, and mass-market economics.10 Failure here is often commercial and developmental, not a verdict that mitochondria do not matter.
5. Transformed by half-life extension. Exenatide to liraglutide to semaglutide is the canonical PK-to-market story; insulin basal analogues tell a parallel story in an older franchise.20
6. Transformed by device / route. Pens, cartridges and oral SNAC presentations changed who could use products and how payers classified them. Rybelsus’s DKK 22.1 billion in 2025 company sales is the commercial proof that oral enhancer strategy is not merely scientific theatre. Device and formulation patents can outlast naive readings of compound expiry.2
7. Vertical integration winner. Franchise owners that funded API and fill-finish ahead of demand converted scarcity into sales rather than into waiting lists — when execution worked. The later clearance of major GLP-1s from shortage lists is the public face of that private capital expenditure.
8. CDMO-reliant developer. Biotech sponsors gain speed and lose queue priority. In a boom, the contract is only as good as reactor time; in a mid- cycle expansion, pricing power can begin to tilt back toward buyers without eliminating scarcity at the best plants.
9. Major shortage — and its unwind. Incretin shortages and chronic insulin access failures are different in wealth of the patient population but alike in mechanism: concentrated supply, rigid processes, sudden demand.182 The 2025 shortage-list clearances and compounding clarifying statements show the reverse transition: when branded supply returns, the grey edge of the market is politically and legally renegotiated.
10. Patent / exclusivity stress. Insulin secondary patents and device IP; secondary digests placing major US semaglutide compound protection near end-2031 and tirzepatide near early-2036; biosimilar litigation that aborts launches.27 Ex-US generic narratives for 2026 must not be mistaken for US compound-patent expiry.
11. Deals that buy capacity or pipeline. Long-term CDMO offtake arrangements (as in Bachem’s disclosed Sisslerfeld collaboration pattern) and classic licensing of peptide platforms are strategic purchases of time. Exact deal tables belong in the company/transaction appendix and should be updated from primary releases rather than remembered.
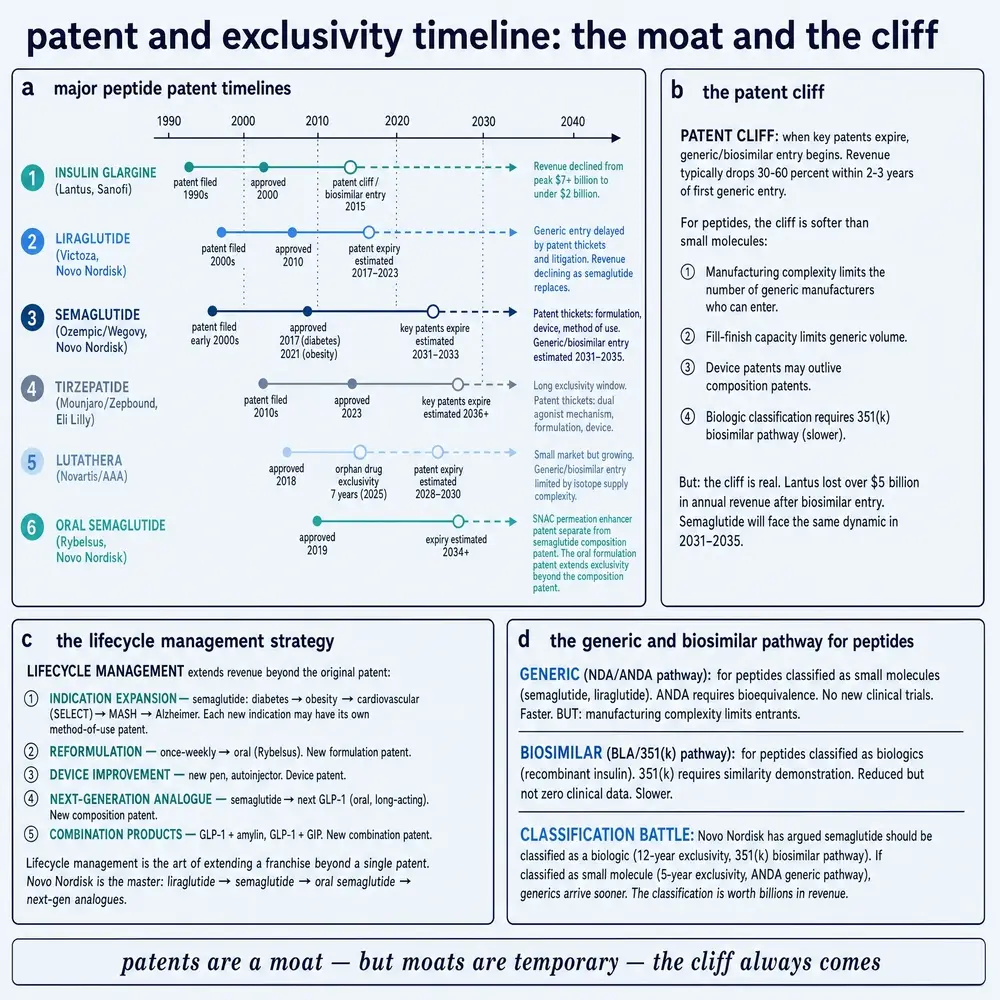
Figure 13 treats exclusivity as a set of clocks. Clocks can be extended, challenged, worked around with devices, or politically overridden by procurement. They are not moral certificates.
Section 18Why some peptide programmes fail commercially
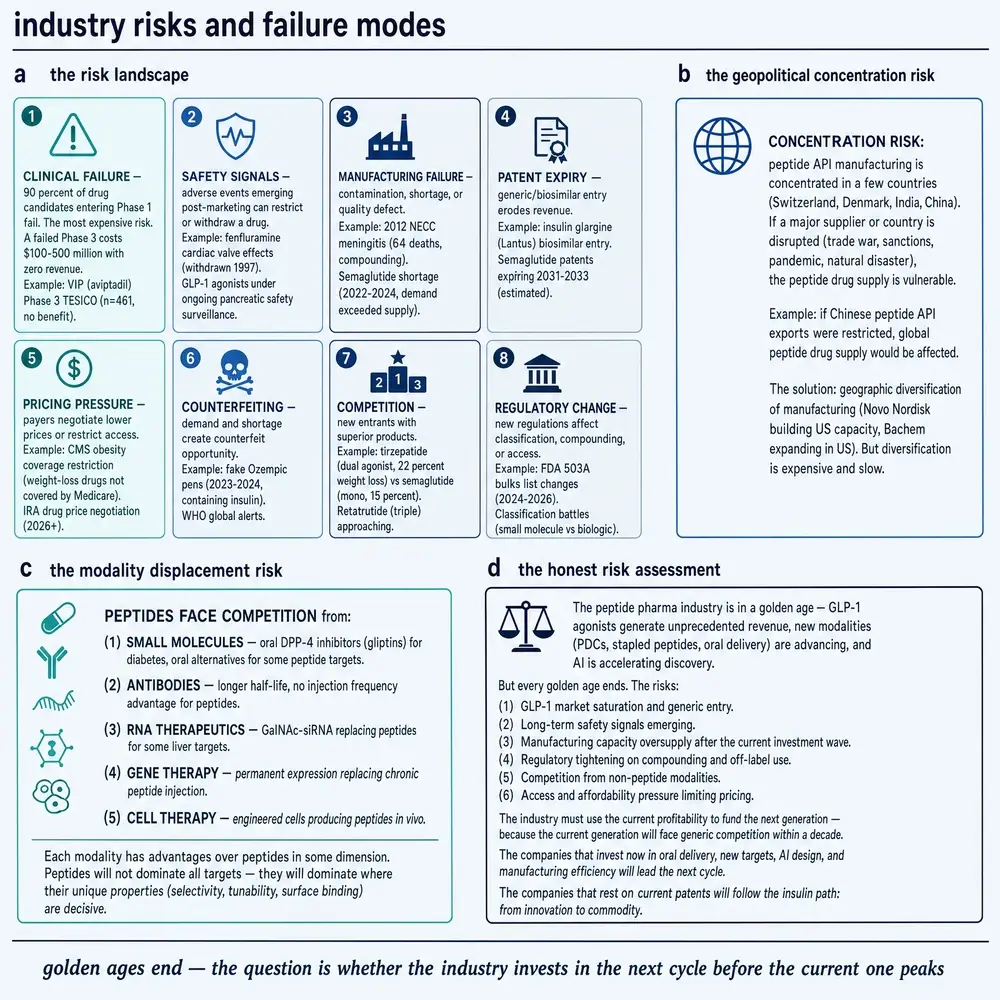
Clinical failure remains the cleanest killer. Safety signals kill less cleanly but just as finally. Reimbursement rejection can strand an approval. Price controls and tendering can strand a margin. Manufacturing failure and contamination are existential for sterile injectables. Counterfeits and falsified pens poison trust. Raw-material and geopolitical concentration turn distant politics into batch delays. Litigation absorbs management attention. Overbuilt capacity after a boom is a silent tax. Market saturation and therapeutic displacement — by a better peptide, an oral small molecule, an antibody, an RNA therapeutic, or a device — are the strategic deaths that look like someone else’s success story. Figure 14 organises that landscape.
Section 19Closing: where value is captured
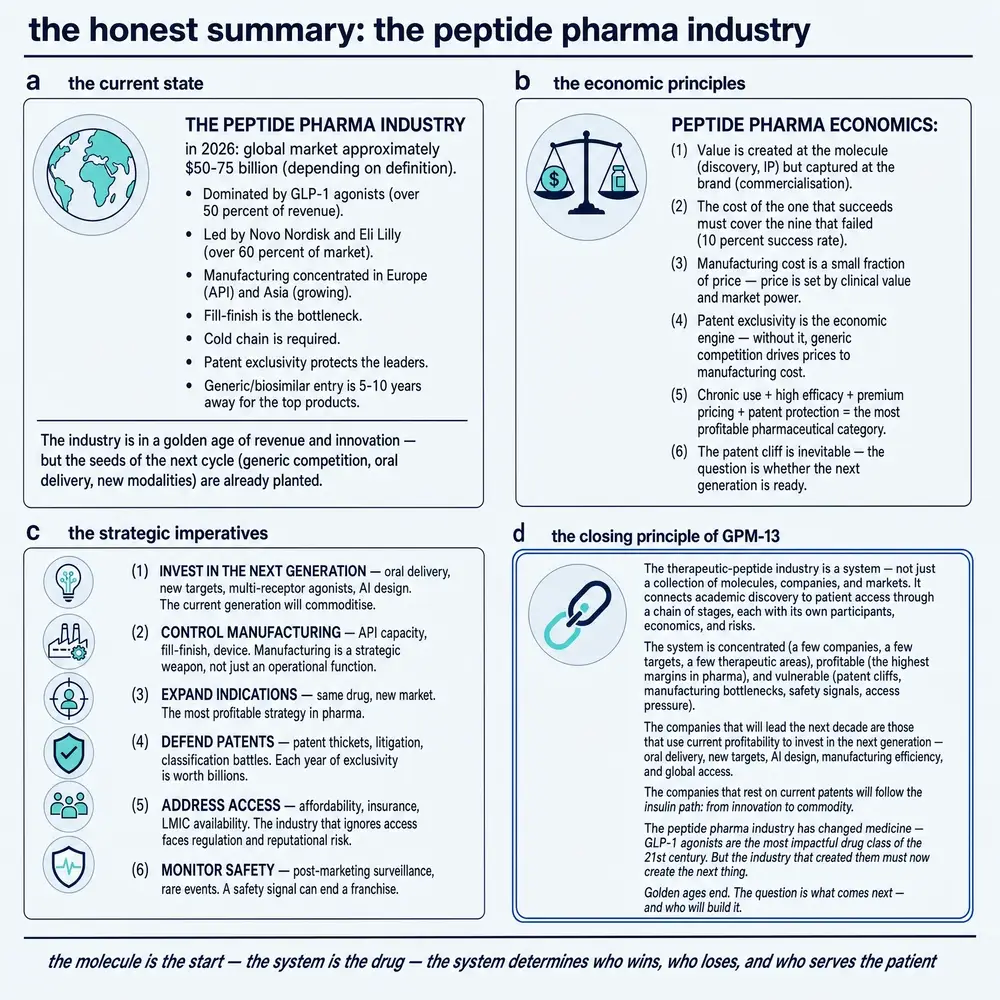
The global therapeutic-peptide industry is best understood as a scarcity machine wrapped around biological messages. Discovery invents options. Development spends fortune to prove them. Manufacturing and devices decide whether proof becomes product. Patents and exclusivity decide how long product can earn. Payers decide how much of list price remains. In the mid-2020s, a handful of incretin franchises pulled the industry’s centre of gravity toward metabolic disease and toward whoever could make pens — and oral SNAC tablets — at unprecedented scale. That fact is real. It is not the whole map. Insulin’s unfinished access crisis, somatostatin and radioligand strategies, bone and fertility niches, CDMO geography, longer-interval and dual-agonist challengers, and the contest with oral small-molecule incretins all still belong in any honest account.
For companies, the strategic question is not “is peptides hot?” It is “which scarce step can we own, rent, or leapfrog — and what happens to us if that step stops being scarce?” The 2022–2026 arc already answered part of that question: scarcity created compounding grey markets and political attention; capacity investment and shortage clearance began to put the legal market boundary back where franchise owners wanted it; CDMO expansion started to reopen buyer leverage without abolishing queues. For readers, the practical question is simpler: when you see a famous pen, ask who owns the factory behind it, who owns the clock that protects it, and who owns the coverage that pays for it. Those three answers explain more of the industry than any single market-size headline.
No human use, dose, route or schedule is recommended in this monograph. Product profiles are discussed as commercial and scientific objects, not as advice.
Section 20Glossary
API. Active pharmaceutical ingredient.
Biosimilar. Highly similar biological product licensed against a reference biologic under a dedicated pathway; not a simple small-molecule generic.
CDMO / CMO. Contract development and manufacturing organisation / contract manufacturing organisation.
CER. Constant exchange rates (company reporting convention).
COGS. Cost of goods sold.
Fill-finish. Sterile filling and finishing of drug product into vials, cartridges or pens.
Franchise. A product family and its lifecycle extensions treated as a strategic revenue engine.
GLP-1 / GIP. Incretin-pathway receptors central to several metabolic peptide medicines.
Gross-to-net (GTN). Difference between list-like sales and realised net sales after rebates and discounts.
HTA. Health technology assessment.
RUO. Research-use-only materials; not approved medicines (see GPM 11).
SNAC. Salcaprozate sodium; permeation enhancer used in a boundary oral peptide product phenotype.
SPPS. Solid-phase peptide synthesis.
Vertical integration. Owning multiple value-chain stages (e.g. API + fill-finish) inside one enterprise.
Section 21Abbreviations
API · BLA · CAGR · CDMO · CER · CMC · COGS · CRO · DTC · EMA · FDA · GIP · GLP-1 · GnRH · GTN · HTA · IP · LMIC · M&A · NDA · PBM · PK · PRRT · RUO · SNAC · SPPS · T2D
Section 22Limitations
Public filings and open literature under-represent some industry reports, patents and paywalled pipeline databases. Company segment reporting rarely isolates “all peptides.” Syndicated market totals conflict by definition. CDMO customer volumes are often confidential. This monograph therefore privileges filings and labelled estimates over false precision.
Section 23References
The list below is numbered and sorted by first-author surname. Bibliographic fields are taken from each source record’s own metadata — author, title, journal, year, volume, issue, pages and identifiers. Company filings cited in prose are anchored to the disclosure period named in the text. In-text citations are the superscript numbers throughout the document.
- Alexander L, Purnell JQ, Burridge K, Cornier M, Golden A, Horn DB, et al.. Joint TOS/OMA/OAC expert guidance statement on the pharmacological management of United States adults with overweight or obesity using the GRADE approach☆. Obesity Pillars. 2026;18:100254.
PMID 41859682 · doi:10.1016/j.obpill.2026.100254 · PMC12997229 - Barber MJ, Gotham D, Bygrave H, Cepuch C. Estimated Sustainable Cost-Based Prices for Diabetes Medicines. JAMA Network Open. 2024;7(3):e243474.
PMID 38536176 · doi:10.1001/jamanetworkopen.2024.3474 · PMC10973901 - Bayat S, Perumal-Pillay VA, Suleman F. Availability and pricing of insulin and related diagnostics in South Africa. Journal of Pharmaceutical Policy and Practice. 2024;17(1):2372467.
PMID 39015751 · doi:10.1080/20523211.2024.2372467 · PMC11251433 - Coskun T, Sloop KW, Loghin C, Alsina-Fernandez J, Urva S, Bokvist KB, et al.. LY3298176, a novel dual GIP and GLP-1 receptor agonist for the treatment of type 2 diabetes mellitus: From discovery to clinical proof of concept. Molecular Metabolism. 2018;18:3.
PMID 30473097 · doi:10.1016/j.molmet.2018.09.009 · PMC6308032 - DiStefano MJ, Dardouri M, Moore GD, Saseen JJ, Nair KV. Compounded glucagon-like peptide-1 receptor agonists for weight loss: the direct-to-consumer market in Colorado. Journal of Pharmaceutical Policy and Practice. 2024;18(1):2441220.
PMID 39776466 · doi:10.1080/20523211.2024.2441220 · PMC11703442 - Galindo RJ, Cheng AYY, Longuet C, Ai M, Coskun T, Malik R, et al.. Insights into the Mechanism of Action of Tirzepatide: A Narrative Review. Diabetes Therapy. 2025;17(1):19.
PMID 41196501 · doi:10.1007/s13300-025-01804-w · PMC12847476 - Ghade NS, Thappa DK, Lona J, Krishnan AR, Sonar SM. Comparative physicochemical and structural characterisation studies establish high biosimilarity between BGL-ASP and reference insulin aspart. Scientific Reports. 2024;14:4224.
PMID 38378730 · doi:10.1038/s41598-024-54819-x · PMC10879530 - Godman B, Haque M, Leong T, Allocati E, Kumar S, Islam S, et al.. The Current Situation Regarding Long-Acting Insulin Analogues Including Biosimilars Among African, Asian, European, and South American Countries; Findings and Implications for the Future. Frontiers in Public Health. 2021;9:671961.
PMID 34249838 · doi:10.3389/fpubh.2021.671961 · PMC8264781 - Jiang C, Nie M, Lu Y, Jiang T, Guo D, Qi P, et al.. Impact of China’s National Volume-Based Procurement policy exclusively for insulin on the volume, expenditure and price: an interrupted time series analysis in Guangdong Province. Frontiers in Public Health. 2025;13:1659721.
PMID 40988682 · doi:10.3389/fpubh.2025.1659721 · PMC12450972 - Karaa A, Bertini E, Carelli V, Cohen BH, Enns GM, Falk MJ, et al.. Efficacy and Safety of Elamipretide in Individuals With Primary Mitochondrial Myopathy. Neurology. 2023;101(3):e238.
PMID 37268435 · doi:10.1212/WNL.0000000000207402 · PMC10382259 - Kawalec P, Stawowczyk E, Tesar T, Skoupa J, Turcu-Stiolica A, Dimitrova M, et al.. Pricing and Reimbursement of Biosimilars in Central and Eastern European Countries. Frontiers in Pharmacology. 2017;8:288.
PMID 28642700 · doi:10.3389/fphar.2017.00288 · PMC5463127 - le Roux CW, Done N, Brnabic AJM, Zion A, Lipkovich I, Kadziola Z, et al.. Comparative effectiveness of tirzepatide and semaglutide for obesity management in US clinical practice: a 6-month retrospective cohort study. Journal of Endocrinological Investigation. 2026;49(2):413.
PMID 41661445 · doi:10.1007/s40618-025-02792-1 · PMC12924827 - Lempesis IG, Dalamaga M. Obesity pharmacotherapy reimagined: The era of multi-receptor agonists and next-generation metabolic modulators, perspectives and controversies. Metabolism Open. 2026;30:100463.
PMID 41948476 · doi:10.1016/j.metop.2026.100463 · PMC13051938 - Luukkanen SV, Tolonen HM, Airaksinen M, Saarukka LSM. The Price and Market Share Evolution of the Original Biologics and Their Biosimilars in Finland. Biodrugs. 2022;36(4):537-547.
PMID 35793041 · doi:10.1007/s40259-022-00540-y · PMC9271098 - Morolla D, Beran D, Ewen M, Raviglione M, von Schoen-Angerer T. Role of biosimilar introduction on insulin glargine prices: a retrospective analysis in 28 European countries. BMJ Open. 2025;15(1):e090484.
PMID 39890142 · doi:10.1136/bmjopen-2024-090484 · PMC11795371 - Niazi SK. Oral delivery of peptides and proteins: pharmacokinetic boundaries, negative selection, and route triage. Frontiers in Drug Delivery. 2026;6:1776167.
PMID 41939723 · doi:10.3389/fddev.2026.1776167 · PMC13047097 - Ononge S, Kakaire O, Mwembezi J, Nakatudde H, Mutumba R, Mugahi R, et al.. Cost-effectiveness results comparing heat-stable carbetocin & other uterotonics in postpartum heamorrhage prevention in Uganda. PLOS Global Public Health. 2025;5(4):e0003562.
PMID 40261858 · doi:10.1371/journal.pgph.0003562 · PMC12013952 - Saeed A, Lambojon K, Saeed H, Saleem Z, Anwer N, Aziz MM, et al.. Access to Insulin Products in Pakistan: A National Scale Cross-Sectional Survey on Prices, Availability, and Affordability. Frontiers in Pharmacology. 2022;13:820621.
PMID 35431962 · doi:10.3389/fphar.2022.820621 · PMC9010947 - Schnell O, Agarwal A, Azizi M, Ballwieser D, Barnard-Kelly K, Battelino T, et al.. CVOT Summit Report 2025: advances along the cardiovascular–kidney–metabolic disease continuum. Cardiovascular Diabetology. 2026;25:142.
PMID 42092956 · doi:10.1186/s12933-026-03140-0 · PMC13147710 - Sidrak WR, Kalra S, Kalhan A. Approved and Emerging Hormone-Based Anti-Obesity Medications: A Review Article. Indian Journal of Endocrinology and Metabolism. 2024;28(5):445.
PMID 39676791 · doi:10.4103/ijem.ijem_442_23 · PMC11642516 - Siew YY, Zhang W. Downstream processing of recombinant human insulin and its analogues production from E. coli inclusion bodies. Bioresources and Bioprocessing. 2021;8(1):65.
PMID 34336550 · doi:10.1186/s40643-021-00419-w · PMC8313369
Section 24Evidence handling
Reported company filings, modelled estimates, syndicated market totals and author inference are separated at the point of use. Peer-reviewed papers are cited when they analyse markets, manufacturing economics, access or competitive structure — not merely when they name an approved peptide in an efficacy study. Recency through 5 August 2026 is preferred but not blindly. No human use, dose, route or schedule is recommended anywhere in this document.
Continue exploring